The old saying “a rising tide lifts all boats” doesn’t always apply to the stock market, and MoneyShow’s Tom Aspray examines the charts of four stocks that have sold off heavily despite the market grinding ever higher.
The major US averages had a choppy session Wednesday as after making new highs early in the session they moved in and out of positive territory. The A/D ratios did close positive with the Nasdaq 100 and Dow Transportation Averages showing the best gains as they were up 0.40% and 0.38% respectively.
The European markets are seeing heavier selling early Thursday with the German Dax Index down 1.3% in early trading. This is consistent with the negative technical readings that I discussed in Tuesday’s column.
The stock index are also down significantly in early trading ahead of the jobless claims. A daily close in the Spyder Trust (SPY) below $151 should signal a decline to the more widely watched chart support in the $149-$149.80 area. This could be the start of the February Surprise and watching how the market acts at stronger support should provide more insight.
As stocks have pushed to the upside, several stocks have seen very heavy selling and they have some common technical characteristics which helped warn in advance of their declines. Let’s look at three of these recent disasters and one stock that may be ready to drop sharply.
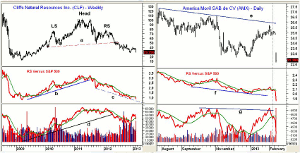
Chart Analysis: Cliff Natural Resources (CLF) not only reported very weak earnings but also reduced its dividend by 76%. The stock dropped almost 20% on five times the average volume.
- This was consistent with the negative weekly and daily technical outlook discussed in 3 High-Yield Disasters last September.
- The weekly chart shows that a head and shoulder top was completed in May when CLF closed below the neckline (line a).
- Once below the late 2012 low at $28.33, the next long-term support is in the $23.30-$25 area.
- The weekly relative performance broke its uptrend (line b) in September 2011 and then rebounded back to its declining WMA.
- This was the start of a long-term downtrend and the RS line has made lower lows, line c.
- The daily relative performance (not shown) dropped below its WMA last week.
- The three-year uptrend in the on-balance volume (OBV), line d, was broken in the spring of 2012.
- The OBV did rebound back above its WMA in December but will drop back below it this week.
America Movil SAB de CV (AMX), the Mexican telecommunications giant, also missed its earnings Wednesday. AMX dropped 9.3% on volume of 30 million shares, which was four times the daily average.
- AMX had rallied in early 2013 back towards the daily downtrend, line e, in the $26 area.
- The lows from November have been decisively violated with next long-term support in the $20.60 area.
- A break of this level would complete a major long-term top formation.
- The daily relative performance has formed lower lows since last September (line f).
- By February 7, the RS line was clearly below its WMA (line 1).
- The daily OBV briefly surpassed its resistance, line g, in early February and in four days was back below its WMA.
- The first strong resistance is well above current levels at $24.50-$25.50.
NEXT PAGE: One Stock Shows Ominous Signs
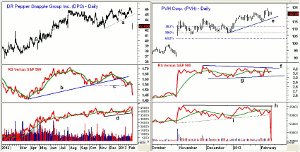
|pagebreak|Dr. Pepper Snapple Group Inc. (DPS) met its revenue estimates but missed on its EPS and the market was unforgiving as it gapped lower and dropped 5.8% on over six times the average volume.
- The down gap through the daily uptrend, line a, took DPS also below the November lows at $42.53.
- The major 38.2% Fibonacci support from the 2011 low at $34.33 is at $41.77 with the 50% support at $40.35.
- The uptrend in the relative performance, line b, was broken on January 11 and support (line c) was broken six days later.
- The weekly RS line (not shown) dropped below its WMA in early January.
- The OBV dropped below its WMA on Tuesday, just one day before prices plunged.
- There is initial resistance now at $43.56-$44.12.
PVH Corp. (PVH) is a textile company that produces apparel and owns well-known brands like Tommy Hilfiger and Calvin Klein. They just completed their acquisition of Warnaco (WRC) on Wednesday and they report earnings on March 22.
- The stock closed slightly lower on Wednesday but the volume at over 17 million was much greater than the daily average of 1.1 million shares.
- The short-term daily uptrend, line e, is now at $117 with 38.2% Fibonacci support at $111.51.
- There is stronger support from last fall in the $107 area, which corresponds to the 50% support.
- The quarterly pivot is at $106.46.
- The daily relative performance has formed lower highs since December, line f.
- A drop in the RS below support at line g would be more negative.
- The daily OBV also did not confirm the highs in 2013, line h, and has been below its WMA since January 30.
- There is resistance now at $122.46 to $124.53.
What it Means: The action in three of these stocks reinforces that one cannot be complacent with any of their holdings. In all instances, either both or one of the RS and/or OBV studies were negative prior to the drop in their stock price. All three are likely to decline further especially in a weak market.
Income investors need to pay attention to the technical outlook. As I mentioned last fall “I would encourage income investors to at least take a look at the weekly charts of any income stock they are looking to buy. Those who want to go a bit further should also look at the RS and OBV analysis to see if they are supporting the decision to buy.”
The action of PVH Corp. (PVH) looks quite ominous and holders of the stock should either get out now or monitor their positions closely.
How to Profit: No new recommendations
Editor’s Note: If you’d like to learn more about technical analysis, attend Tom Aspray’s workshop at The Trader’s Expo New York, February 17-19. You can sign up here, it’s free.


