Although the Eurozone’s demise has been frequently forecast, it has managed not only to survive, but also thrive, as MoneyShow’s Tom Aspray examines whether now is a good time to jump in or wait for further pullback.
As the US stock market has continued to grind higher, the Eurozone countries have corrected from the highs that they made at the start of February. The Vanguard MSCI Europe (VGK) is down 3.2% from its highs and a similar pullback in the Spyder Trust (SPY) would take it back to the $147 level.
The US market was again quite resilient on Monday, as while the ranges were tight, the major averages closed above the day’s lows. The bank stocks did the best Monday as they closed the day with solid gains.
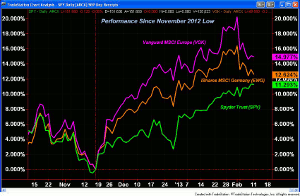
The % performance chart compares the performance of the Vanguard MSCI Europe (VGK), iShares MSCI Germany Index (EWG) and the Spyder Trust (SPY) since the November 16 lows. Both VGK and EWG were much stronger than SPY on the rally up to the mid-December highs.
The Eurozone ETFs also held up much better than the SPY on the late December drop and were strong in January as VGK was up over 20% at the start of February. It is now just up 15% for the time period. EWG has also declined from highs and is getting close to SPY’s performance line.
Can this correction go further or is now the time to buy?
NEXT PAGE: Is This a Warning for the US Market?
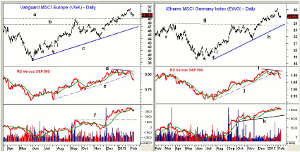
|pagebreak|Chart Analysis: The Vanguard MSCI Europe (VGK) has approximately 448 stocks in its portfolio with net assets of over $10 billion. It has a current yield of 2.89%. VGK is already close to first support, line a, in the $49 area. This also corresponds to the September highs.
- There is more important support in the $47.50 area, line b, with the quarterly pivot at $47.61.
- The major 38.2% Fibonacci support from the 2012 lows is at $46.55.
- The relative performance peaked at the end of December and formed lower highs.
- The uptrend from the July lows in the RS, line e, was broken late last week.
- The daily on-balance volume (OBV) did confirm the recent highs but has now dropped slightly below its WMA.
- The weekly OBV (not shown) did confirm the highs and is still holding well above its WMA.
- There is initial resistance at $50-$50.70, with further at the quarterly R1 at $51.38, and the recent highs at $51.59.
The iShares MSCI Germany Index (EWG) has 60% of its assets in their top ten holdings with assets of over $4 billion. It current yields is 2.26%.
- EWG peaked at $26.19 and the quarterly pivot with next support at $24.50.
- There is more important support at line g, in the $23.85 area.
- The 38.2% Fibonacci support from the 2012 lows is at $23.30.
- This also corresponds to the quarterly pivot level and the daily uptrend, line h.
- The daily relative performance has also formed a negative divergence over the past six weeks, line i.
- The weekly RS line has also formed a negative divergence and has dropped below its WMA.
- This divergence was confirmed by the break of its uptrend, line j.
- The daily OBV has held up well as it is still barely above its WMA.
- The weekly OBV did confirm the highs and is well above its support.
- There is resistance now in the $24.50 area.
What it Means: It does look like many of the Eurozone markets have completed short-term tops but it will be the strength or weakness of the next one-three-day rally that will tell us more. They will need to rally sharply to reassert their uptrends otherwise a one-three-day rally is likely to be followed by a further decline.
Is the Eurozone giving an early warning of the US market? It may be.
In my opinion, the risk at current levels is too high and but I will be watching these two ETFs to see if they test their quarterly pivot levels. To keep the intermediate-term outlook positive, I would expect them to hold their quarterly pivots.
How to Profit: No firm recommendation for now, but I will be watching them closely over the next month or so.
Portfolio Update: I attempted to take some partial profits near the recent highs in the iShares MSCI Italy (EWI) at $15.15, but the high was $14.64. Still should be long EWI from $12.16 with a stop now at $13.14 that was almost hit last week. I would sell ½ at $13.98 or better.
Editor’s Note: If you’d like to learn more about technical analysis, attend Tom Aspray’s workshop at The Trader’s Expo New York, February 17-19. You can sign up here, it’s free.


