A popular strategy, sector rotation involves choosing winning sectors from the broad market and tilting your portfolio towards them. As we start a new month, MoneyShow’s Tom Aspray takes a technical look at which sectors are poised to outperform.
Stocks corrected for the second day in a row, but once again the losses were small though most of the major averages did close below Wednesday’s lows. Of course, the wild card is Friday’s monthly jobs report. The ADP report came in well above estimates at 192,000.
If the jobs report is weaker than expected, it could cause some heavier selling but I would expect the market to be well supported at lower levels. In fact some heavier selling could be a plus as it would help to reduce the rising bullish sentiment.
In the last Week Ahead column, I discussed the seasonal tendency for the stock market to decline in February. So far, we do not have any sell signals but there are some signs that there has been a loss of short-term momentum.
I continue to think that now is the time to be cautious and work on your buy list as there should be a better buying opportunity in the next month or so.
So should you be looking at the large cap, mid-cap, or small cap stocks for your buy list?
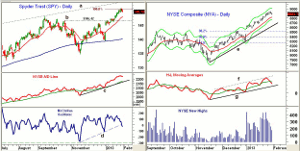
Chart Analysis: The Spyder Trust (SPY) exceeded the equality or 100% target this week at $150.70 with the trend line resistance, line a, now at $152.40. It has risen just over 12% from the November lows.
- The 20-day EMA is now at $148.07 with more important support at $146.42, line b.
- From the recent highs, the 38.2% Fibonacci retracement support is now at $144.73.
- The NYSE Advance/Decline line did confirm this week’s highs. It is still well above its WMA and the uptrend, line c.
- The McClellan oscillator has dropped below the zero line and its uptrend, line d.
- The late December low was at -128. It is now at -27.
- On a daily close back above $150.70, the SPY should rally to convincing new rally highs.
The NYSE Composite made new rally highs Wednesday at 8944 with the daily starc+ band now at 9017. For next week, the starc+ band. will be at 9106.
- The rising 20-day EMA is at 8821 with further chart support at 8674-8740.
- The daily uptrend, line e, is currently at 8636.
- The 5WMA of the H-L has dropped below the 13 SMA but it did confirm the highs (line f).
- There is more important support at the uptrend, line g, and then at the late December lows.
- The number of NYSE new highs peaked at 440 on January 2 and then hit 435 on January 24.
- This slight divergence does not seem enough to suggest that a top is in place.
NEXT PAGE: Sectors Showing Strength & Weakness
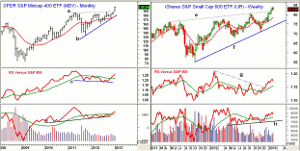
|pagebreak|The monthly chart of the SPDR S&P Midcap 400 ETF (MDY) shows the completion of a two-year flag formation, lines a and b, with January’s strong close. The ETF opened 2013 at $190.07, which was an all-time high.
- From the November low of $171.53, MDY is up 16.6%.
- This month the starc+ band is at $210.
- The chart formation has long-term upside targets in the $240.250 area.
- The monthly studies are all positive as the relative performance moved above its WMA at the end of November.
- The on-balance volume (OBV) tested is monthly support, line d, on several occasions in 2012 before moving back above its WMA before the end of the year.
- The weekly studies are positive and have moved well above the 2012 highs.
- The first band of support is in the $192-$195 area with more important at $188, which was the September 2012 high.
The iShares S&P Small Cap 600 ETF (IJR) has surpassed the trend line resistance, line e, over the past two weeks. It has risen 17.8% from the November lows.
- For February, the monthly starc+ band is at $89.72.
- The weekly relative performance broke through its downtrend, line g, but looks ready to turn lower this week.
- The RS line has failed to move above the early 2012 highs.
- The OBV moved above its WMA in the middle of December, which was perfect timing for the January effect.
- The OBV has not been acting stronger than prices as is just barely moved above the September highs.
- Good OBV support now at line h.
- The monthly technical studies (not shown) are also positive.
- There is first good support in the $80 area with the quarterly pivot at $77.29.
What it Means: Looking at the relative performance analysis in all time frames can help you refine your sector selection and the timing of your entries or exits. The small-cap ETF IJR has beaten the large cap SPY by over 5% since the November lows. The current RS analysis suggests that the small-cap stocks are starting to act weaker that the mid caps.
Therefore when the market does correct, I will be favoring the mid-cap stocks and will look towards buying MDY rather than IJR.
The Royce Value Trust Inc. (RVT) and Royce Micro-Cap Fund (RMT) that were recommended in December are both up well over 11%. They are both trading near their weekly starc+ bands and those who have multiple equity should take some partial profits now.
How to Profit: No new recommendation
Portfolio Update: Should be 50% long the Royce Value Trust Inc. (RVT) at $12.98, with a stop at $13.08. Sell half the position at $14.55 or better.
Should be 50 long the Royce Micro-Cap Fund (RMT) at $9.08, with a stop at $8.82. Sell half the position at $10.18 or better.
Editor’s Note: If you’d like to learn more about technical analysis, attend Tom Aspray’s workshop at The Trader’s Expo in New York, February 17-19. You can sign up here, it’s free.


