With the stock market at a new five-year high, MoneyShow’s Tom Aspray takes a technical look at the top-performing sectors for potential buy candidates should the market pull back in February.
As January 2013 draws to a close, five of the Select Sector SPDR ETFs have outperformed the S&P 500 by at least 1%. In such a short time this is pretty impressive but it has been quite a month for stocks and they are now getting more attention from investors.
Though the close above 1,500 in the S&P 500 is positive for the intermediate term, I am now becoming more cautious on the stock market as I discussed last Friday. The seasonal tendency is for stocks to have a correction in February, and now that everyone seems to be arguing the bullish case, the risk is much higher.
In the current environment, one has to be a very selective and patient buyer with a focus on risk. The Select Spyder Sector performance table shows that of the top five performers so far in 2013, all except the Select Sector SPDR Energy (XLE) were on December’s Best Sector Bets list for 2013.
Two of the top performers from 2012 the Select Sector SPDR Financial (XLF) and the Select Sector SPDR Consumer Discretionary (XLY), are also doing well so far in 2013 up 6.6% and 7.3% respectively. One of my favorites for most of 2012, the Select Sector SPDR Health Care (XLV) was down 0.6% in the 4th quarter of 2012 but is up 7.4% so far in 2013.
The best performer so far in 2013 has been the Select Sector SPDR Energy (XLE), which has closed higher 10 out of the last 11 days and is up 7.7 % in January. Though we have not had a setback to buy XLE we have several oil stocks in our portfolio. Let’s look at the weekly analysis of the top sectors to see which look like the best buys after a correction.
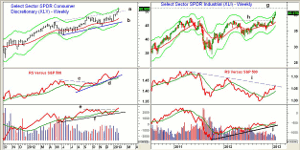
Chart Analysis: The weekly chart of the Select Sector SPDR Consumer Discretionary (XLY) show the strong close last week that was at the daily starc+ band.
- XLY is now not far below the weekly starc+ band at $51.50 while the monthly is at $53.07.
- Two weeks ago XLY closed above the trend line resistance at line b at $49.70.
- The relative performance dropped back to test its uptrend, line d, and its WMA in late December.
- The RS line has now made new rally highs, which confirmed the breakout above resistance (line c) last October.
- The weekly OBV has just broken through its resistance, line e, which also confirms the price action.
- First good support at $49 to $49.16, which corresponds to the 20-week EMA and the early 2013 highs. Further support will be in the $48-$48.40 area.
The Select Sector SPDR Industrial (XLI) is up 6.8% since the start of the year and the weekly chart shows the breakout above resistance, line h, at the start of the New Year.
- The close was just below the weekly starc+ band at $40.73 with the monthly at $42.21, which is close to the long-term resistance at line g.
- The completion of the recent trading range has upside targets in the $43 area.
- The relative performance has just broken its downtrend, line i, as it has been above its WMA since the end of October.
- The on-balance volume (OBV) has been in an uptrend since the 2011 lows, line i, and has just made marginal new highs.
- The rising 20-day EMA is at $39.29 with further support in the $38.60 area.
- The 20-week EMA is at $37.77 with the quarterly pivot is at $37.64.
- The late December low was $37.04, which just missed our buy level at $37.02
NEXT PAGE: Two More Top-Performing Sectors |pagebreak|
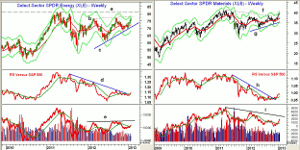
The Select Sector SPDR Energy (XLE) dropped to a low of $69.57 on December 31 and closed last Friday at $71.42.
- Last week’s close was strong with trend line resistance (line b) at $78.02 with the weekly starc+ band at $78.75.
- There is long-term resistance from the May 2010 in the $80.90 area, line a.
- The weekly relative performance has just broken its downtrend, line d, that goes back to the 2011 highs.
- The RS line is above its WMA but is still below the 2012 highs.
- The weekly OBV is now above its WMA but has major resistance now at line e.
- The daily technical studies are positive and do look much stronger.
- There is first good support now in the $74-$75.20 area with stronger at $73-$73.30.
- The quarterly pivot and more important support is at $71.99.
The Select Sector SPDR Materials (XLB) has done just a bit better than the S&P 500 so far this year but did not perform as well in 2012.
- XLB gapped to the upside to start off the New Year and has not had much in the way of a pullback. There is next resistance at $41.28, which was the 2011 high.
- The completion of the triangle formation, lines f and g, has upside targets in the $44-$46 area.
- The RS line broke its downtrend, line h, in November and has now completed its bottom formation.
- The daily relative performance does show a short-term negative divergence.
- The weekly on-balance volume (OBV) has moved above its WMA but is still below its longer-term downtrend, line i.
- The daily OBV has confirmed last Friday’s new rally high.
- There is first support now in the $38.80-$39.20 area with the quarterly pivot at $37.17.
What it Means; The gains in the various sector ETFs are impressive, and while they can still go higher over the near term, the risk of buying them is too high at current levels. The “Wall of Worry” I discussed at the start of January has come crashing down despite the weakness in market darlings like Apple, Inc. (AAPL).
In reviewing individual stocks over the weekend, there are still some stocks that just appear to be bottoming and I would expect them to hold up well when the market corrects. Yields did increase late last week and they look ready to test my next upside targets. This could be a further positive for stocks.
We just missed the buying levels from early January in the Select Sector SPDR Materials (XLB) and the Select Sector SPDR Industrials (XLI) by a few cents but will look to buy on a decent correction.
How to Profit. For the Select Sector SPDR Industrials (XLI), go 50% long at $38.88 and 50% long at $38.16, with a stop at $36.44 (risk of approx. 5.4%).
For Select Sector SPDR Materials (XLB), go 50% long at $38.76 and 50% at $38.08, with a stop at $36.48 (risk of approx. 5.0%).
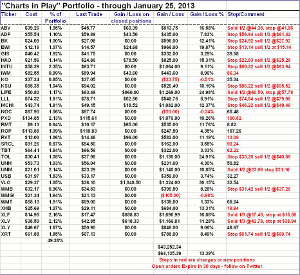
Portfolio Update: The Charts in Play portfolio is long the Select Sector SPDR Financial (XLF) at $14.40 and added to longs at $15.92. We sold 1/3 Friday at $17.45; use a stop at $15.66.
We are long the Select Sector SPDR Health Care (XLV) at $36.14 and added 50% long at $40.04 and 50% long at $39.76. We sold 1/3 on Friday at $42.78; use a stop now at $38.94.
For the Select Sector SPDR Consumer Discretionary (XLY) we are 50% long at $46.88 and 50% long at $46.26, with a stop at $46.77.
NEXT PAGE: The Charts in Play Portfolio |pagebreak|


