With the last FOMC meeting of the year out of the way, focus shifts back to the countdown to the fiscal cliff. MoneyShow's Tom Aspray shares what the charts say about the short-term outlook for the markets as we head into the last few trading days of the year.
The S&P 500 made new rebound highs in the middle of the afternoon, but then the sellers took over as the press conference by Fed Chairman Ben Bernanke made traders more nervous. The upside breakout early in the week likely stopped out the majority of those who remained on the short side of the market.
The stock index futures were weak early Thursday, but are now flat. After a 7.3% gain in the futures from the November lows to yesterday’s highs, the markets are overdue for a rest. The selling could be exacerbated by the realization that our leaders in Washington are even more stubborn/incompetent that we previously imagined
Now that the FOMC meeting is behind us, we still have the Euro Council meeting that ends on Friday. After the June meeting, there was an uptick in volatility and if the Eurozone ministers start fighting, it could pressure stocks over the near term. The strength of the consumer is a growing concern after last week’s drop in consumer sentiment, so many will be closely watching today’s Retail Sales report.
As discussed below there has been further improvement in many of the technical studies so a short-term pullback should be a buying opportunity in some of the strong sectors, as well as the stocks in those sectors.
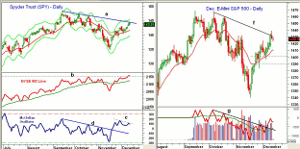
Chart Analysis. The daily chart of the Spyder Trust (SPY) shows that the downtrend from the September-October highs was slightly exceeded yesterday. The daily starc+ band is now at $145.44, which is 1.3% above Wednesday’s close.
- There is initial support now at $142.40, with the 20-day WMA at $141.55.
- From Wednesday’s high, the 38.2% Fibonacci retracement support is at $140.79.
- This would typically be a good entry level using Fibonacci analysis.
- The NYSE Advance/Decline line has moved above the October highs, line b, which reaffirms the positive intermediate-term outlook.
- On a correction, the A/D line could pull back to its WMA, but should not drop below the November lows.
- The McClellan oscillator broke its downtrend, line d, two days after the market lows.
- The McClellan oscillator has now formed a short-term negative divergence, line c, which is consistent with a short term top.
The December E-Mini S&P 500 futures had a high Wednesday of 1438.75 as the downtrend, line f, was just barely exceeded. The futures closed at 1427.25, down over four points for the day. The futures are flat a couple of hours before the opening.
- There is next support in the 1420 area and then at 1415, with the rising 20-day EMA at 1410.
- The 38.2% Fibonacci retracement support from Wednesday’s high is at 1401, which is above the key swing low at 1396.75.
- The 50% support is at 1389.25 but the futures should not drop that low.
- The daily OBV has improved in the past week after breaking its downtrend, line g.
- Once above Wednesday’s highs, the next major resistance is at 1459 and 1466, which corresponds to the twin October highs.
NEXT PAGE: Minor Correction or Serious Decline? |pagebreak|
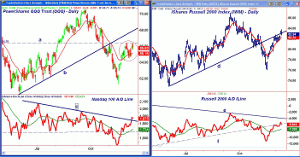
The PowerShares QQQ Trust (QQQ) made two attempts in the past eight days to break through the resistance at $66.39. QQQ could be forming a short-term double top (see circle).
- There is first support now at $65.15-$65.40 and the rising 20-day EMA.
- There is further support now at $64.53, which if broken on a closing basis would complete the top formation.
- A completion of the top has downside targets in the $62.80-$63 area.
- The Nasdaq 100 A/D line surged through its downtrend, line c, this week.
- The A/D line still needs to surpass the summer highs to complete a major bottom.
- The A/D line is in a clear short-term uptrend and well above its WMA.
- Once above the $66.39 level the former trend line (line b) and further resistance is in the $68 area.
The iShares Russell 2000 Index (IWM) regained its former uptrend, line d, over the past two days. The 61.8% Fibonacci retracement resistance at $82.83 was also overcome.
- There is additional resistance at $84.15 and then at $85.26.
- The rising 20-day EMA at $82.34 is the first support with more important in the $81.40-60 area.
- There is more important support in the $79.63-$80.40 area and a correction should hold above the November 28 lows.
- The Russell 2000 A/D line turned down Wednesday, but it is still well above its rising WMA.
- This is the first uptrend in the A/D line since September, but there is still major resistance at line e.
What it Means: The weak close Wednesday could be the start of a minor correction that could last a few days. There are no signs yet of a more serious decline as the NYSE A/D line is acting stronger than prices. It has made new highs while the NYSE Composite is still 1.6% below its September highs. A higher close today will suggest a correction will need to come from higher levels.
The Nasdaq 100, as represented by the QQQ, still looks the most vulnerable. It would only take one strong up day to complete a short-term bottom in Apple Inc. (AAPL), which would take the pressure off the tech sector.
If we do drop back to stronger support, I like the top four performing sector ETFs, as well as the closed end small cap funds I discussed yesterday. They have already reached their initial buy zones while yesterday’s order in IWM is still open.
How to Profit: For the iShares Russell 2000 (IWM), go 50% long at $82.38 and 50% long at $81.42, with a stop at $79.11 (risk of approx. 3%).


