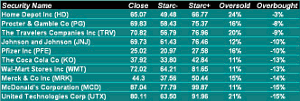
The monthly overbought/oversold scan of stocks in the Dow Industrials can be used to identify future market leading stocks, and Moneyshow's Tom Aspray likes two from this month's scan.
The Nasdaq Composite did the best of the major averages gaining 1.1% with Consumer Discretionary the top sector, up 3%. Overseas markets did well as the Stoxx Europe 600 Index was up 2% for the month, beating the Spyder Trust (SPY) by 1.5%. The German DAX was up 2.7% with the Hang Seng Index up 1.7% as overall the overseas markets continue to act much better. The charts of many of the international ETFs also look stronger technically and are still favored once they see a decent pullback.
The late buying Friday may have been caused partially to rebalancing of the MSCI Indexes, but the futures have tacked on further gains early Monday so the rally is still intact. The 61.8% Fibonacci retracement resistance for the S&P 500 is at 1424.43 and there are likely quite a few stops above this level they may need to be hit before we get a correction. Still, I would not be chasing the indices as buying stocks at good support seems to be the best strategy.
Therefore I was anxious to look at my monthly and weekly scan of stocks where they are ranked relative to their upper and lower Starc bands. The starc band analysis is one way I determine whether a stock is in a high- or low-risk buy or sell zone. When a stock is close to its monthly Starc- band (oversold), then it is a low-risk buy and a high-risk sell.
It also can help identify those stocks that are performing stronger or weaker than the S&P 500. For example, this month’s most overbought stock is Home Depot (HD). It also led the list at the end of February 2012 when it closed the month at $47.57 and just 1% below the monthly starc+ band at $48.07. Since then the stock is up over 36% as shown by the monthly analysis, which can be helpful in identifying major trends.
In this month’s scan I focus on four of the ten most overbought Dow stocks as two in particular are looking attractive for new purchase at the right price.
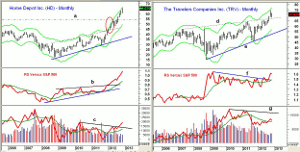
Chart Analysis: For the past three months Home Depot (HD) has traded near its monthly starc+ band. On the chart (circled in red) you can see that from January-April of this year HD also closed near its upper monthly starc band. This sets the stage for a three-week, 12.6% correction in May before the uptrend resumed.
- In the middle of August, HD broke through resistance at $53.74 (line a) that went back to 2001.
- The monthly relative performance or RS analysis shows a long-term uptrend going back to 2008 when it completed a major bottom.
- The RS line has surged sharply since late 2011 as it has clearly been a market leader.
- The monthly OBV moved back above its WMA in late 2011 and broke through its downtrend, line c, in August.
- It is still well below the highs made in 2007-2008.
- The weekly analysis (not shown) is clearly positive and shows no signs of topping out.
- There is monthly pivot support for December at $61.25 to $61.85 with important chart support in the $58 area.
The Travelers Companies Inc. (TRV) is third on the most overbought list though it is down 5% from the October high at $74.70. It is currently 9% below its monthly starc+ band.
- The monthly chart shows that long-term resistance, line d, at $66.60 was overcome in September, line d.
- The monthly relative performance broke through its resistance, line f, in May 2012.
- The RS line is close to its 2009 high and is well above its rising WMA.
- The monthly OBV has been lagging the price action as it is just barely above its WMA and well below the major resistance at line g.
- The weekly OBV (not shown) is below its WAM and suggests the correction is not yet over.
- There is initial support now at $69.60 with more important at $67.50-$68.
NEXT PAGE: Two Stocks To Buy On A Pullback
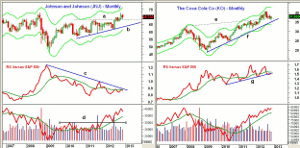
|pagebreak|Johnson and Johnson (JNJ) overcame the 2011 high at $68.11 (line a) at the end of July and had a high in October of $72.74, which was just below the all time high of $72.76. The breakout level was re-tested in November.
- The monthly relative performance has just dropped slightly below its WMA and is still below its long-term downtrend, line c
- The weekly RS line (not shown) does show a pattern of higher highs and higher lows which is more positive.
- The monthly on-balance-volume (OBV) completed a major bottom in 2011 as it overcame resistance at line d.
- The OBV pulled back to test its rising WMA in May and continues to look strong.
- The weekly OBV has just moved back above its WMA.
- There is initial support at $69-$69.30 with stronger in the $68 area. Stops need to be at least under the August low of $66.85
The Coca Cola Co. (KO) has been a favorite from early in the year and was a stock that I focused on in a recent trading lesson as this chart illustrated. At the end of March the long-term resistance in the $36 area, line e, was overcome.
- In November, KO came fairly close to its monthly uptrend, line f, which is now at $35.10.
- The monthly relative performance is now testing its uptrend, line g, but is still below its WMA.
- The RS line did not confirm the recent highs but it would take a drop below the February lows to weaken the outlook.
- The monthly OBV surged above its WMA in October 2010 and has remained strong.
- The weekly OBV is below its WMA suggesting that we should still see one more pullback.
- Initial support now at $36.80-$37.20 with stronger in the $35.80-$36 area.
What it Means: Though Home Depot (HD) can still go higher over the next month or so, I would not chase it at current levels. Travelers Companies Inc. (TRV) has a good looking chart but the weak OBV makes me cautious right now, but I will be keeping an eye it.
Both Johnson and Johnson (JNJ), which yields 3.5% and Coca Cola Co. (KO), which yields 2.7% look attractive on a pullback in the next week or so where the risk can be well controlled.
How to Profit: For Johnson and Johnson (JNJ), go 50% long at $69.04 and 50% long at $68.30 with a stop at $66.64 (risk of approx. 3%).
For Coca Cola Co. (KO), go 50% long at $37.16 and 50% long at $36.70 with a stop at $34.82 (risk of approx. 5.7%).


