These two market leading stocks have corrected more sharply than the overall market from their September highs and MoneyShow’s Tom Aspray takes a critical look to see if either is now ready to turn around.
The passing of Greece’s austerity bill fulfills the main conditions for them to receive their next payment but the Eurozone finance ministers do not yet seem convinced. Clearing this hurdle may help stem the selling in the stock market. The futures are up slightly in early Monday trading. With banks and the bond market closed on Monday trading is likely to be light.
With less than two weeks before Black Friday many are trying to balance their fear of the fiscal cliff with the surprisingly upbeat attitude of the consumer as we enter the holiday buying season. The consumer sentiment has continued to improve since August and November’s mid-month reading was a new five year high.
The latest data on retail sales is out Wednesday and after three months of solid gains a slight decline is forecast by most economists. More importantly investors are trying to assess how the holiday season buying will impact Apple, Inc. (AAPL) and Amazon.com, Inc. (AMZN) as both have dropped sharply from their September highs.
Apple, Inc. (AAPL) is down 22.4% from its September high, while Amazon.com, Inc. (AMZN) has lost 14.3%. This is much worse that the 6.6% drop in the Spyder Trust (SPY). For the year however AAPL is still up 36.4% while AMZN has gained 30.7% as both have done much better that the 11.7% gain in the SPY.
These two stocks could provide the spark for a year-end rebound in the badly beaten down Nasdaq 100. Both are now approaching important levels of support but are there any signs that the worst of the selling is over?
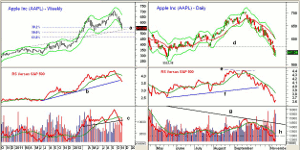
Chart Analysis: Apple, Inc. (AAPL) has declined for seven weeks in a row and closed last week just above the weekly starc- band at $540. The 38.2% Fibonacci support at $554.66 was violated last week.
- This makes the next Fibonacci target at $508.33, which is the 50% support level calculated from the 2011 low at $310.50.
- For November the monthly starc- band is at $507.30.
- The trend line support from the 2011 and early 2012 highs, line a, is now being tested.
- The weekly relative performance or RS analysis did make a new high with prices in September but then violated its WMA and the uptrend, line b.
- The monthly RS line (not shown) is still above its WMA.
- Volume was especially heavy last week at 131 million shares as the OBV has broken support (line c) that goes back to early 2012.
- The OBV is also well below its WMA.
The severity of the decline in Apple, Inc. (AAPL) is more evident on the daily chart as it closed below the daily starc- band last Thursday. Since early October it has stayed below its 20-day EMA, which is now at $598.
- The daily chart shows that the support at $570, line d, was broken last week.
- This corresponded to the key support in the rally from the May 2012 lows and should now be a first key level of resistance.
- There is further resistance in the $590-$600 area.
- The daily relative performance did form a negative divergence, line e, at the September high of $705.07.
- The more important support for the relative performance at line f was broken on October 18.
- The RS line is still acting weak as it is well below its declining WMA.
- The daily OBV also turned negative by the start of October as it has stayed below its WMA.
- The OBV has also broken support, line h, that goes back to the May lows.
NEXT PAGE: Is a Year-End Rally in the Cards?
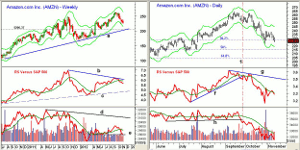
|pagebreak|Amazon.com, Inc. (AMZN) closed last week 5% above its weekly starc- band at $214.59. The chart shows converging support in the $203, line a, to $206.37, which was the early June low.
- The chart shows further support from late 2011 and early 2012 in the $190-$196 area.
- The weekly relative performance did not confirm the price high in September as it formed lower highs, line b.
- The RS line has dropped below its WMA and now has long term support at line c.
- The on-balance volume (OBV) was also weaker than prices on the recent rally as it stayed well below the highs from 2011, line d.
- The OBV is back below its WMA and is now testing support at line e.
- There is first weekly resistance now in the $238-$240 area.
The daily chart of Amazon.com, Inc. (AMZN) shows that the 38.2% Fibonacci support from the late 2011 lows at $226.80 was broken in late October.
- After rebounding to the $240 area AMZN is no dropping back towards the October lows.
- The daily relative performance broke its uptrend, line f, on September 24.
- The downtrend in the relative performance, line g, is now key resistance.
- The RS line needs to move above its last two highs to signal stabilization.
- The OBV dropped through good support, line h, and on September 26, line 1, along with the RS Analysis was clearly negative.
- The daily OBV is now close to its lows and could form a positive divergence this week.
- A close above $240 should signal a rally to the $250-$252 area.
What it Means: I do expect both companies to do well during the holiday season and both are likely to break sales records. However, both Apple, Inc. (AAPL) and Amazon.com, Inc. (AMZN) still look negative technically based on the weekly and daily analysis. They are momentum stocks, which are widely watched by traders and active investors and either could give daily buys signals before the end of the month. The long term outlook is the most positive on AAPL.
In October, I expected the support for Apple, Inc. (AAPL) in the $570 level to hold and recommended going 50% long at $614.72 and 50% long at $603.44. Both were stopped out at $567.82.
Since it closed at the weekly starc- band, AAPL may be getting ready for an oversold rally. On a seasonal basis AAPL normally bottoms in early October and then rallies until May. Buying near the 50% support and risking to under the 61.8% support should be a good strategy for investors.
Amazon.com, Inc. (AMZN) normally forms a secondary top at the end of November and declines to a seasonal low in February. AMZN should find good support in the $205-$215 area and this week’s action may be important.
How to Profit: Those who are determined to buy Apple, Inc. (AAPL) could consider selling the December $520 put at $15 or better. This means if you exercise the stock at $520 your actual purchase price would be $505. The major support is at $470.
A similar strategy for Amazon.com, Inc. (AMZN) would be to sell the December $215 put at $8 or better, and risk to under $190.
Both of these suggestions require that you are committed to buying the stock and that you understand the risk of naked option positions. Once the option position is exercised and the stock purchased you must use a stop on the stock position.
For the model portfolio I will be watching the short-term action in both stocks closely so keep an eye on my Twitter feed for specifics.


