The stock market’s sharp post-election drop had some signs of panic liquidation and Moneyshow’s Tom Aspray explains why a disciplined technical approach can help you avoid selling with the crowd.
Wall Street voted Wednesday, and it was clear that many have little confidence that the two parties can come together to avoid the fiscal cliff. The 312-point drop in the Dow Industrials was matched by a similar percentage drop in the more broadly based S&P 500. Banks stocks were hit the hardest as the KBW Bank Index dropped 4.56%.
Over the past month the financial media seemed to think that a Romney victory would be best for the markets. Though many market pros seemed to feel the same way one should not forget that their primary goal is to make money. The selling Wednesday had some signs of panic liquidation as “get me out at any price” seemed to be the prevailing sentiment.
Many probably remember August 6, 2011, when the US lost its AAA credit rating and the Dow lost 635 points and the S&P dropped 80 points or 6.7% to close at 1119. Over the next month, the bearish sentiment continued to build as most were convinced we would see another recession. Instead the market formed a strong technical bottom in October and is now 24.5% higher.
The point is that selling when everyone else is also selling is rarely a good idea. Reacting to the fear of an economic development like the fiscal cliff can never be part of a disciplined investment plan. That is why it is important to have an exit strategy in place when you buy a stock or ETF. Then you can have a good assessment of the risk involved and have a better chance of not getting swept up in the crowd mentality.
While the intermediate-term outlook for the stock market is still positive, the short-term momentum is negative and there are no signs yet of a bottom. In fact, many of the technical studies are not yet oversold.
I would not be surprised to see another sharp down day before the current correction is over. It is important that investors and traders keep an eye on the key price levels and technical indicators outlined below so that you can have an objective reading of the market’s outlook
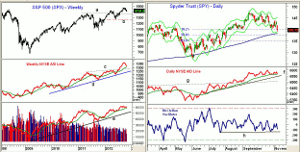
Chart Analysis: The weekly chart of the S&P 500 (updated through 11/3) goes all the way back to the 2009 lows and shows a long-term pattern of higher highs and higher lows.
- The S&P 500 has now dropped below the support from the early 2012 highs with the close below 1400.
- The support from the early 2011 highs is at 1373, line a, while it would take a close below 1266 (line b) to confirm a weekly downtrend.
- The weekly NYSE Advance/Decline line (the broadest measure of the market internals) broke through major resistance in July, line c. This is typically an intermediate-term bullish signal.
- The weekly NYSE Advance/Decline line made a new high with prices in September and is still above its WMA.
- The weekly OBV also confirmed the recent highs and is above its WMA.
- There is long term support for the OBV at line e.
- There is initial resistance now at 1410-1415 and it would take a close above 1435 to suggest that a bottom was forming.
The daily chart of the Spyder Trust (SPY) shows that Wednesday’s drop has taken it close to the daily starc- band at $138.94. The rising 200 day MA is at $138.19
- The 38.2% Fibonacci retracement support from the June lows has been broken with 50% support at $137.64.
- The weekly starc- band is at $135.30 with the 61.8% support at $135.16.
- The daily NYSE A/D line is still holding above its WMA and the lows from the past two months.
- The daily uptrend, line f, is not far below current levels with more important support at line g.
- The McClellan oscillator is still locked in a trading range between +200 and -150 (line h). It is currently is not providing much insight on the short term trend.
- There is first resistance at $141-$141.50 with more important in the $144 area.
NEXT PAGE: Is the Set-up for a Year-End Rally in Place?
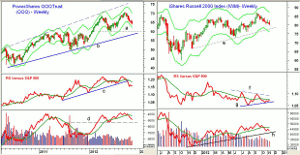
|pagebreak|The PowerShares QQQ Trust (QQQ) has had a steady slide from the September highs as it has lost over 9%. It closed Wednesday just above the 61.8% support from the June lows.
- The weekly starc- band is at $62.57 with major support in the $60 area, line a.
- The longer term uptrend, line b, is now at $58.30.
- The weekly relative performance did make slight new highs with prices in September, but violated its WMA and the uptrend (line c) four weeks ago.
- The weekly OBV has also dropped below its WMA with key support at line d and the early 2012 lows.
- The volume was quite high on Wednesday and the daily OBV (not shown) is still well below its declining WMA.
- There is first strong resistance now in the $66-$66.50 area.
The iShares Russell 2000 Index (IWM) is down 7.6% from its recent highs and close just above the important support in the $80 area.
- The 50% Fibonacci retracement support is at $79.95 with the 61.8% support at $78.30.
- There is weekly chart support now at $77.70, line e, with the weekly starc- band at $76.23.
- The weekly relative performance still shows a slight uptrend, line g, suggesting it has been stronger than the S&P 500.
- The RS line needs to move above its downtrend, line f, and its previous high to complete a bottom formation.
- The on-balance volume (OBV) did confirm the price high in September, but this will be the fourth week that it has been below its WMA.
- There is next support for the OBV at the uptrend, line h.
- The daily OBV (not shown) shows a positive volume spike last week so the OBV is still above its recent lows.
- There is resistance now for IWM in the $81.50-$82.50 area.
What it Means: The major averages have now reached more important support, which increases the chances that stocks will rebound over the next few days. However, this week’s selling suggests that it will now take more time before a tradable low is in place.
It is encouraging that the small- and mid-cap averages are starting to outperform the S&P 500. This is more consistent with a year-end rally than a decline.
It will be important that those stocks, which appear to have already bottomed are able to hold above their recent lows. This includes the oil stocks.
How to Profit: No new recommendation


