Investors often ignore the excessive risk associated with those instruments that offer huge yields, writes MoneyShow’s Tom Aspray, who points out how the warning signals from the charts can help you avoid high-yield failures.
Stocks put in an impressive performance Monday, which was a welcome relief after last week's decline. The market internals were strong, with advancing issues leading the decliners by a 2:1 margin.
As I noted last week, it will take several consecutive days like Monday to suggest that the correction is over. The Spyder Trust (SPY) has trend line resistance in the $147 area. A completion of the daily flag formation would project a move to the $150 area or 1,500 on the S&P 500.
A further rally is needed to help relieve the pressure on agency-backed REITs, which have been hit hard since the Fed’s decision on September 13 to buy mortgage debt. One high-yield favorite has been Annaly Capital Management (NLY), which is down double digits in the past month.
I have been warning for the past year that these highly touted stocks are “high-yield traps." The recent decline has reinforced why those who buy these high-yielding REITs must be nimble and watch the charts, since complacency can wreck one’s entire portfolio.
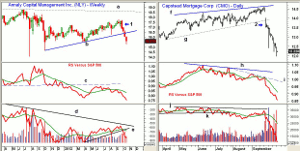
Chart Analysis: The narrowing spread between short- and long-term rates has made it harder for Annaly Capital Management (NLY) to maintain its 12.5% yield, which is now almost double that of high-yield bond funds. Their last quarterly dividend reflected a 16% drop from a year ago.
- NLY has dropped 14% from its mid-September high of $17.75, and the last week of September was critical for holders of NLY. The candle chart shows a bearish pattern that week (point 1), as NLY closed below the prior six week lows.
- The close that week was at $16.84, which was just 5.1% below the highs. The highs and lows of the past four to six weeks should be monitored.
- The relative performance dropped below its WMA in early August, which was a sign of weakness.
- The weekly on-balance volume (OBV) confirmed September’s weak close, as support (line e) was broken.
- The long-term downtrend in the OBV (line d) goes back several years.
- The down gap opening on September 27 on heavy volume turned the daily OBV (not shown) negative.
- There is initial resistance now in the $16 to $16.50 area.
Capstead Mortgage Corporation (CMO) is a $1.2 billion, Dallas-based REIT that currently yields 11.6%. It peaked at $14.58 on September 24, when it was yielding 9.8%.
- The gap through support on the daily chart (line g) on September 26 was a strong warning to investors that they should get out.
- The daily relative performance had been diverging from prices since late July, as it formed lower highs (line h) while prices formed higher highs (line f).
- The RS line broke support in August and began to diverge more sharply from prices (line i).
- The OBV dropped below its support (line k) in July, and then failed to confirm the new price highs (line j)
- After the initial drop, CMO declined another 8%, spiking to $12.39 as wide stops were probably finally hit.
- There is initial resistance at $12.75, and then even stronger levels at $13 to $13.40.
NEXT: Why to Avoid These REITs Now
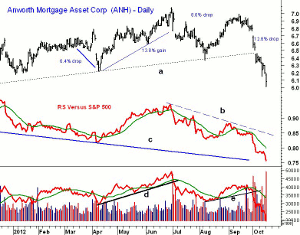
|pagebreak|Anworth Mortgage Asset Corp. (ANH) is a $846 million REIT that currently yields 9.6%, down from the 12.8% it was paying in March. The chart shows several wide swings in 2012.
- For example, ANH dropped 6.4% from the mid- March highs to the end of the month. ANH then rebounded 13.8% from those lows, and peaked in late June. This set the stage for the 8.6% drop into the middle of July.
- The recent drop of 12.6% violated the daily uptrend (line a), which has further weakened the technical outlook.
- The relative performance has formed lower lows over the past few years (line c).
- The peak in July started a new short-term downtrend (line b), and the RS line has been below its WMA since September 12.
- The volume was heavy in early July, as the OBV dropped below its support (line d) and its WMA.
- After a rebound from the August lows, the OBV dropped below its WMA a few days before prices plunged.
What it Means: Though the weekly and daily studies do favor even lower prices in the next few months, all three are oversold, as they have been dropping below their weekly Starc- bands for several weeks.
The most important message for investors from these examples is that they are not buy and hold instruments. Therefore, investors must continually monitor the price action. The charts show that they can easily move 10% or more in a short period of time, which can easily negate the benefits of their attractive yields.
These plays have the ability to be attractive trading vehicles, but they must be monitored closely, and one needs to have a firm plan in place. If you want to take the risk associated with a double-digit yield, you need to use a hard stop that makes the risk-reward acceptable
For those who are long, look for a rally back to resistance to get out...but be sure you have a stop underneath, in case the rally does not materialize.
How to Profit: No new recommendation.


