Small-cap stocks have come to the forefront this month, says MoneyShow’s Tom Aspray, who has two names with strong charts and positive revenue growth that he likes for new purchases on the current pullback.
September has been a strong month for small-cap stocks, as the iShares Russell 2000 Index Fund (IWM) has risen 5.2%. The all-time highs from May 2011 have been slightly exceeded.
The relative performance analysis for the past year has favored the large-cap Spyder Trust (SPY) over the small-cap IWM. But this has now changed, and typically a shift in the RS analysis in favor of small caps lasts for three to four months or more.
Tracking a basket of stocks based on their revenue instead of their capitalization is a relatively new approach. RevenueShares introduced its first three revenue-tracking ETFs in 2008, with the rationale that revenue is more difficult to manipulate than net income.
Both their large-cap and small-cap revenue ETFs are now leading the market higher, and these two small-cap high-revenue stocks have just broken out.
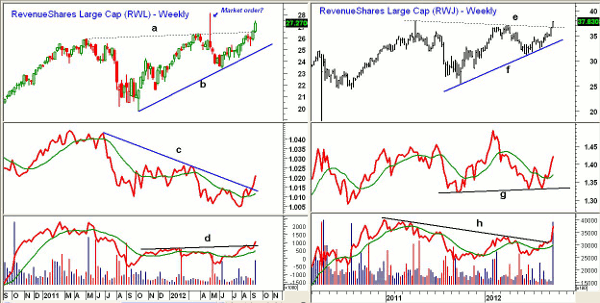
Chart Analysis: The RevenueShares Large Cap ETF (RWL) is a relatively small ($150 million) and rather thin ETF with three-month average volume of 24,000. This is way too thin for me to recommend, but it gives an interesting perspective on high-revenue, high-cap stocks.
- The weekly chart shows the completion of a 16 month triangle or flag formation (lines a and b). The spike on May 1 was likely the result of someone placing a market not a limit order.
- The completion of the chart formation suggests these stocks may take over a leadership role for some time.
- The next upside targets are in the $29 area, then $32.
- The RS analysis moved through its yearlong downtrend two weeks ago, and shows a completed bottom formation.
- The volume last week was the highest since June, and the on-balance volume (OBV) has broken through resistance (line d).
- There is initial support now at $26.40, with stronger levels at $25.40.
The RevenueShares Small Cap ETF (RWJ) is also small ($114 million) and has fairly low volume. The weekly chart shows that it has also broken through long-term resistance (line e).
- The 127.2% Fibonacci target is at $41.50.
- The flag formation has upside targets in the $48 area.
- The relative performance has surged above its prior high after holding good support (line g).
- Volume last week was almost 600,000, and was the highest since August 2010, as RWJ was starting a dramatic new rally.
- There is initial support for RWJ now at $36.80, with stronger levels at $35 to $35.50.
NEXT: 2 Stocks with Revenue in the Bag
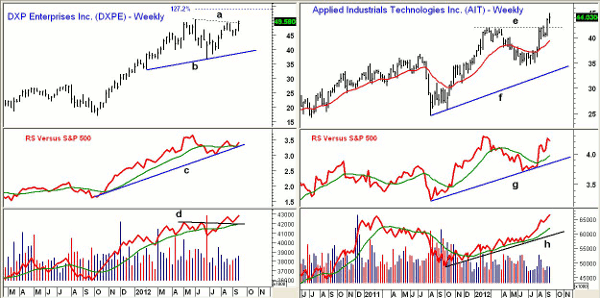
|pagebreak|DXP Enterprises (DXPE) is a $700 million wholesaler of industrial equipment. Its revenue in 2010 was $656 million, with revenue for 2013 estimated to be $1.2 billion.
- Its 2012 second-quarter revenue of $262 million was well above the second-quarter 2011 revenue of $198 million.
- The weekly chart shows that a flag formation (lines a and b) has just been completed.
- The 127.2% Fibonacci retracement target is at $54, while the width of the flag has further targets at $62 to $64.
- The weekly relative performance is back above its WMA after testing its long-term uptrend (line c).
- The weekly OBV broke through resistance (line d) in August, and has turned up after retesting the breakout level.
- There is first good support now at $46.50 to $47.50 with more important levels at $44.50.
Applied Industrials Technologies (AIT) is a $1.6 billion seller of new industrial items, as well as products to maintain and repair industrial equipment. Two weeks ago, the resistance at $42 from early in the year was overcome.
- The company has a quarterly revenue growth rate of over 5%, but is expecting growth of 9% to 13% next year.
- The weekly relative performance confirmed the highs early in the year, and is now close to these highs.
- The RS line is above its WMA and long-term support at the uptrend (line g).
- The weekly OBV has been in a strong uptrend for the past year (line h), and is well above its rising WMA.
- The daily OBV (not shown) did confirm the upside breakout.
- Initial support for AIT sits at $41.50 to $42.50 area, followed by $39.50 to $40.
What it Means: The strong action of the small-cap stocks is consistent with investors' willingness to take on more risk. Nevertheless, only the most aggressive investors should have a higher weight in small caps than they do in the large-cap stocks.
These two stocks look attractive on a retest of their recent breakout levels, and their history of revenue growth makes them especially attractive in the current slow-growth economy.
The two ETFs also look good but are too thin for a formal recommendation.
How to Profit: For DXP Enterprises (DXPE), go 50% long at $47.68 and 50% long at $46.88, with a stop at $44.34 (risk of approx 6.2%).
For Applied Industrials Technologies (AIT), go 50% long at $42.09 and 50% long at $41.48, with a stop at $38.77 (risk of approx 7.2%).


