There has been a seismic shift in the sentiment and technical outlook for the stock market since the June lows. MoneyShow's Tom Aspray explains why now is not the time to let the markets get the best of you.
Up through Thursday's close, the Spyder Trust (SPY) has tacked on almost another 1% for the week. Since the June 4 lows, it has gained 10.6%, while the PowerShares QQQ Trust (QQQ) is up 11.2%.
The change in sentiment has been even more dramatic. After a dismal May, many were preparing for Greece leaving the Eurozone, and the concern was that the contagion could spread to Spain and Italy.
Investor sentiment had also become more bearish. Some 45% of individual investors were bearish on June 7, according to AAII. Now only 27% are bearish, as the market has continued to grind higher, rewarding those on the long side and punishing those on the short side.
In June, most of the TV pundits were looking to sell a rally. But yesterday an analyst on Bloomberg said, "I expect the S&P 500 to be up around 1,400 for most of August."
The technical outlook has also seen a significant change, as in early June, the market internals generated classic buy signals, as they were acting stronger than prices. Over the past two weeks, the market internals have been acting weaker than prices.
The major averages are also now at stronger resistance, so it is important to hold off on new buying, take some profits, and most of all have a plan. Here is why...
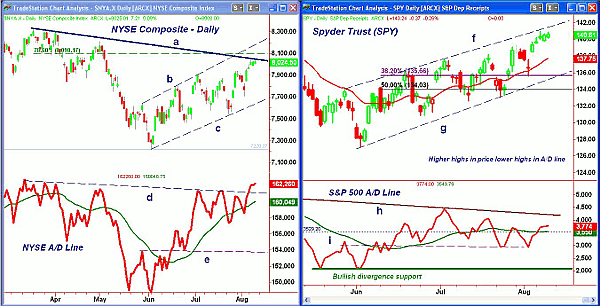
Chart Analysis: The NYSE Composite has reached the downtrend from the March highs (line a) this week, but has failed to close above the 78.6% resistance at 8,098.
- The upper channel on the daily chart (line b) is in the 8,200 area.
- The NYSE Advance/Decline line was able to move above key resistance (line d), and is above the March highs.
- The A/D line is in a short-term uptrend, and is above its WMA, but shows no signs of upward acceleration.
- A drop in the A/D line below the most recent lows would weaken the outlook.
- There is initial support now at 7,900, with stronger levels at 7,650 to 7,700, which is 4.6% below current levels.
The Spyder Trust (SPY) has been trading over the $140 level for the past three days and the ranges have narrowed. The upper boundary of the trading channel (line f) has been tested.
- There is further resistance at $141.66 to $142.21, which are the highs from early in the year.
- A drop below $139.56 will be the first sign that a correction is underway, with the 20-day EMA now at $137.75.
- Using Monday's high at $140.92, the 38.2% Fibonacci retracement resistance is at $135.66, with the 50% retracement support at $134.03.
- A drop below the 61.8% support at $132.44 would suggest a drop back to the $130 area.
- The S&P 500 A/D line has barely moved higher this week, as it is just barely above the late July highs. A drop in the A/D line below the last two lows will signal a deeper correction.
- A close above the intermediate-term resistance (line h) would be a strong positive signal for the medium-term trend.
NEXT: Key Dow and Nasdaq Levels to Watch
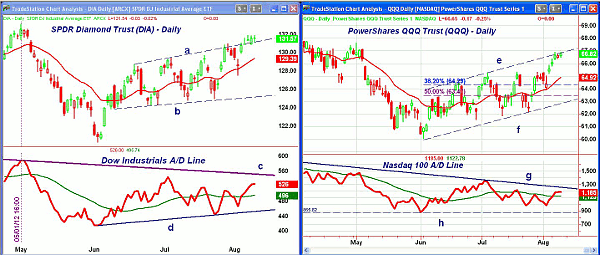
|pagebreak|The SPDR Diamond Trust (DIA) has been holding above the trend line resistance (line a) in the $130.80 area.
- The 20-day EMA is rising sharply, and represents first support at $129.38. More important levels follow at $127.51, which was the August 2 low.
- The lower boundary of the trading range (line b) is in the $125.25 area.
- A daily close under $124.25 would set the stage for a test of the June lows.
- The Dow Industrial A/D line has moved above the prior two highs, but is still well below the bearish divergence resistance (line c).
- Important support for the A/D line is at line d.
- On the upside, the next resistance is the May high at $133.14.
The Powershares QQQ Trust (QQQ) is now testing the upper boundary of its trading channel (line e) in the $66.80 to $67 area. There is additional resistance from late April in the $67.63 area.
- The 2012 high for QQQ was $68.55.
- The Nasdaq-100 A/D line is back above its WMA, but still below the more important resistance at line g.
- A strong close above this level and the early July high would be a very positive signal from the A/D line. On the other hand, a drop in the A/D line below the late July levels would be a sign of weakness.
- There is initial support at $65.25 to $65.50, with the rising 20-day EMA at $64.92.
- Calculating from Tuesday's high at $66.92, the 38.2% Fibonacci retracement support is at $64.29 with the 50% support at $63.47.
- A daily close below the $61.86 to $62.15 level will break the uptrend (line f).
What it Means: Stocks are down in early trading in reaction to weak economic data from China. The Asian market led the decline, while the European averages are down 0.5%. It would take a 1% to 1.5% decline in the S&P 500 to signal that a correction was underway.
A 3.5% drop in the Spyder Trust would take it to the 38.2% support level, and my best guess is that the 38.2% or even the 50% support level will be tested. A drop to 1,300 in the S&P 500 cannot be ruled out.
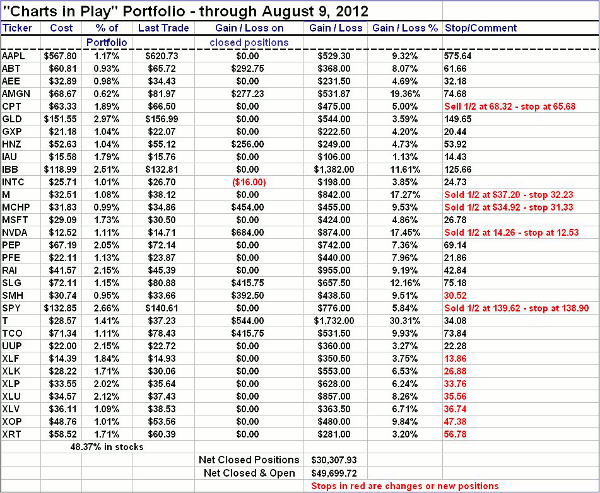
As I will be leaving today for a long vacation, I have updated the portfolio stops accordingly. Take a look at your positions now, and develop a plan now before the market starts correcting.
How to Profit: Investors were long the Spyder Trust (SPY) from $132.85 and sold half at $139.62 or better. Use a stop at $138.90 on the remaining position.
NEXT: See the Current Charts in Play Portfolio
|pagebreak|


