Identifying the best-performing sectors can often give you an edge in selecting the stocks that are most likely to outperform the overall market, says MoneyShow’s Tom Aspray.
There were three sectors that matched or exceeded the Spyder Trust (SPY) 1.98% gain last Friday, as the better than expected jobs number spurred some new buying as well as short covering.
The futures are again higher early Monday, and with a light economic calendar this week, we may get a better idea of the true underlying demand for stocks. As I discussed Friday, the technical indicators are not as strong as the price action, so aggressive new buying is not currently recommended.
In this type of market, sector selection is especially important, and knowing which sectors are showing the best relative performance can help one focus on the stocks in those sectors most likely to outperform the market.
The best sector performer so far in 2012 has been the Select Sector SPDR Technology (XLK), up 16.1% for the year, followed by the 14% gain in the Select Sector SPDR Financials (XLF). Both were recommended in early July.
This quarter’s top performer is the Select Sector SPDR Energy (XLE), up over 6%...but it is just barely positive for the year. The recent strength of the Select Sector SPDR Consumer Discretionary (XLP) could be flashing a positive sign for the economy. Let’s look at these four market-leading sectors.
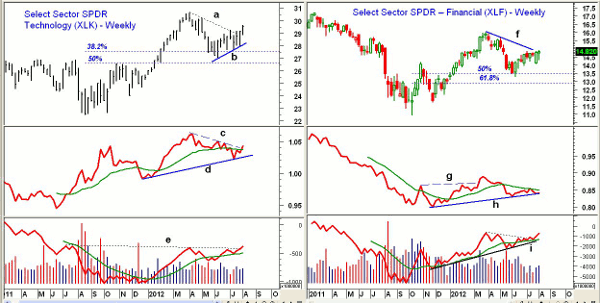
Chart Analysis: The weekly chart of the Select Sector SPDR Technology (XLK) shows the decisive close above the last four-week highs on Friday. The downtrend (line a), has been clearly overcome.
- There is next resistance at $30.22 and then the April high at $30.62. The decline retraced over 38.2% of the prior rally, but held well above the 50% Fibonacci retracement support at $26.55.
- The relative performance has broken its downtrend (line c) and moved above its WMA.
- The weekly on-balance volume (OBV) overcame year-long resistance (line e) on Friday, which is a positive sign.
- The daily RS and OBV analysis (not shown) is positive, but not as impressive as the weekly.
- There is initial support now at $28 to $28.60.
The Select Sector SPDR Financials (XLF) held above the June lows in late July, as the decline to the $14.09 level was well supported. The weekly downtrend (line f) is now being tested.
- The long-term downtrend from the 2011 highs is in the $15.40 to $15.50 area.
- There is key chart resistance in the $15.50 to $16 area.
- The weekly RS analysis staged a brief breakout in March, but then reversed, dropping back below its WMA.
- The RS line is now testing more important support (line h). Despite last week’s strength, it is still below its WMA
- The weekly OBV has been acting stronger than prices, as it is back to the April highs. The OBV has strong support now at line i.
- There is initial support now at $14.34 to $14.09, as the major 50% Fibonacci retracement support at $13.48 was tested in June, but not violated on a weekly closing basis.
NEXT: Can These Two Recent Hot Performers Keep Going?
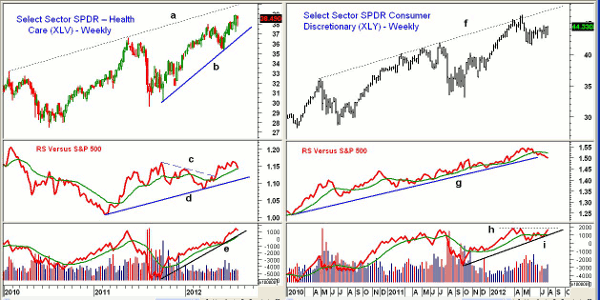
|pagebreak|The Select Sector SPDR Health Care (XLV) is up over 11% so far this year, having easily exceeded the April highs at $38. Since June, it is up over 9%.
- The upper trend line on the weekly chart (line a) is now in the $40 area.
- The RS analysis turned lower last week, and has dropped back to its rising WMA.
- The RS line broke through its downtrend (line c) in early May, signaling that it was once again ready to outperform the S&P 500.
- The weekly OBV has confirmed the new highs, and is well above support (line e) and its rising WMA.
- There is initial support now in the $37 to $37.80 area.
The Select Sector SPDR Consumer Discretionary (XLY) had a very strong first quarter, gaining 15.6%, and has held up well on the recent correction.
- Over the past eight weeks, XLY has traded in a narrow range, with support at $42.44 and resistance at $44.58.
- The next strong resistance is at $46.27 to $47, which corresponds to the May highs and the weekly resistance (line f).
- The relative performance dropped below its WMA in June, and in the past few weeks has violated its uptrend (line g).
- The daily RS analysis (not shown) is clearly in a downtrend, and it would take some time before it can turn around.
- The weekly OBV is acting much stronger, as it is very close to breaking out above the resistance at line h. It held above its WMA and support (line i) on the recent correction.
- There is first support now at $42.44 to $43, and further levels at $41.44.
What it Means: The long-term technical patterns have kept the tech sector one of my favorites. In early June, there were signs that technical giants like Apple (AAPL), Intel (INTC), and Microsoft (MSFT) had bottomed.
I typically recommend a sector ETF as well as some of the stocks in the sector with the best relative performance. Though the RS analysis of the Select Sector SPDR Consumer Discretionary (XLY) is not impressive, the OBV looks strong.
This sector includes the retail group, which has a strong seasonal trend to bottom in late August or September. Therefore, light buying of new long positions is recommended at lower levels.
How to Profit: For the Select Sector SPDR Consumer Discretionary (XLY), go 50% long at $42.84, with a stop at $40.64 (risk of approx. 5.4%).
Portfolio Update: For the Select Sector SPDR Technology (XLK), investors were 50% long at $28.12 and added another 50% long position at $28.18. Use a stop at $26.88.
For the Select Sector SPDR Consumer Staples (XLP), investors should be 50% long at $33.80 and 50% long at $33.16, with a stop at $33.76.
For the Select Sector SPDR Health Care (XLV), investors should be 50% long at $36.04. Use a stop at $36.74.
For the Select Sector SPDR Utilities (XLU), investors should be 100% long at $34.57, with a stop at $35.56.
For the Select Sector SPDR Financials (XLF) should be 50% long at $14.36. Raise the stop now to $13.86.


