The technical action in these four sectors suggests that investors should look here as the markets enter the second half of the year.
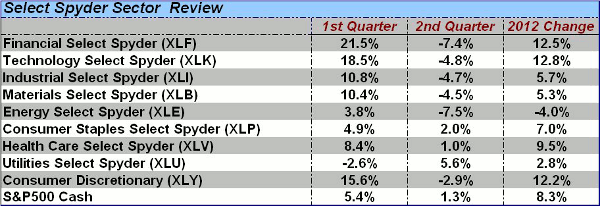
Clearly the second quarter was a tough one for most stock traders, as the star performers from the first quarter, such as the financials, led the way on the downside.
However, Friday’s impressive rally was pretty broad-based, and the improvement in the technical studies suggests that the market has significant upside potential as we head into the election.
As the table below indicates, only the Select Sector SPDR Consumer Staples (XLP) and Select Sector SPDR Utilities (XLU) were able to outperform the S&P 500 during the second quarter.
While the Select Sector SPDR Health Care (XLV) was up slightly, many of the individual health-care stocks did much better. Drug stocks like Pfizer (PFE) and Abbott Laboratories (ABT) were both up over 6% for the month of June.
The best performer was the Select Sector SPDR Utilities (XLU), up 5.6%. Followers of the performance charts that I frequently include in my Week Ahead column will remember that the ETF began to show positive performance for 2012 in the latter part of April.
Two sectors were down over 7% for the quarter: the Select Sector SPDR Financials (XLF) and Select Sector SPDR Energy (XLE). And both ETFs were up sharply for the month of June, or the quarterly results would have been much worse.
So which sectors should do the best in the third quarter?
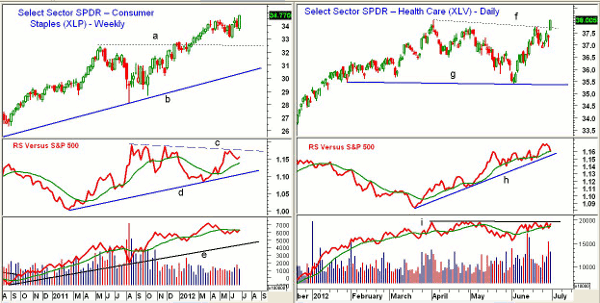
Chart Analysis: The weekly chart of the Select Sector SPDR Consumer Staples (XLP) shows the new all-time weekly closing high on Friday. The completion of the three-month trading range has upside targets in the $35.80 to $36.20 area.
- The weekly relative performance, or RS analysis turned positive in early April, moving back above its WMA
- If the RS line can surpass the resistance (line c), that will suggest consumer staples can continue to be a market-leading sector. There is long-term support at the uptrend (line d)
- The weekly on-balance volume (OBV) turned up Friday, and is just barely below its flat WMA. It has formed a strong long-term uptrend (line e)
- The daily OBV (not shown) has just broken its downtrend
- There is initial support now between $34 and $34.20, with stronger levels in the $33 to $33.60 area
The Select Sector SPDR Health Care (XLV) gapped to the upside last Friday, and completed its trading range (lines f and g). XLV is up 7.4% from the June 4 lows of $35.38.
- The completion of the trading range has upside targets in the $39.80 to $40.40 area
- The RS analysis turned up in March, having moved back above its WMA
- The RS line has been in a solid uptrend since April, as indicated by line g
- The OBV is very close to breaking through resistance (line h)
- There is initial support for XLV at $37 to $37.40, followed by $36 to $36.40
- Major support now sits in the $35.20 to $35.40 area (line g)
NEXT: Tom's Verdict on 2 More Sectors |pagebreak|
In addition to looking at the weekly and daily analysis of the leading sector ETFs, I also monitor the broader sector indices like the S&P Financials. Sometime this analysis can give one different perspectives on which are the leading and lagging sectors.
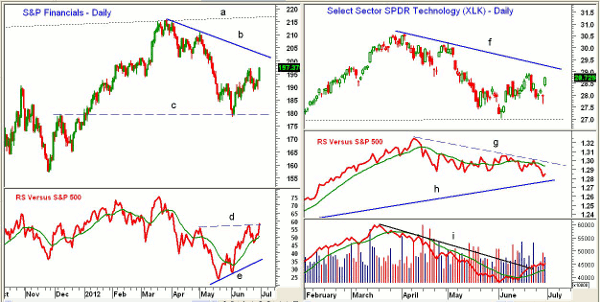
- The daily chart of the S&P Financials shows last Friday’s strong close, with the daily downtrend (line b) in the 203 area
- The major resistance (line a) that goes back to 2011 is in the 217 area, which is 10% above current levels
- The RS analysis formed a positive divergence (line e) at the June lows, which has been confirmed by the move through resistance (line d). This indicates it is now a market-leading sector
- The RS line dropped back to its WMA last week before reversing sharply to the upside
- The S&P Financials held important support (line c) in June
- For the Select Sector SPDR Financials (XLF), the mid-point of last week’s range is at $14.34, which is now first support, with further levels around $13.80 to $14. Key support waits at $13.30
The long-term technical patterns have made the tech sector one of my favorites during the market correction. The Select Sector SPDR Technology (XLK) moved through major resistance in early 2012, which was one of the reasons I've been recommending the tech sector.
- The late May lows at $27.04 brought XLK close to important support
- There is next resistance in the $29 zone, with the daily downtrend following at $29.25. More important resistance can be found between $30.20 and $30.64
- The upper trend line on the long-term charts is in the $31.40 to $31.60 area
- The daily relative performance (line g) is still below its daily downtrend (line h), but did turn up last week
- The RS line is holding well above long-term support (line h)
- The daily OBV broke its downtrend (line i) over a week ago, and is holding well above its rising WMA
- The weekly OBV (not shown) is well above its WMA, and is now approaching important resistance
What it Means: Last week’s performance in the stock market was impressive, but trading is quiet early Monday. If we get the intermediate-term buy signals discussed in my Week Ahead column, it is likely that several sectors will see over 10% gains in the third quarter. The financial and technology sectors are my favorites.
If the market begins to accelerate to the upside the more defensive sectors like the consumer staples and health care may lose their leadership role so careful monitoring of the relative performance analysis will be important.
How to Profit: For the Select Sector SPDR Financials (XLF), go 50% long at $14.36 and 50% long at $14.06, with a stop at $13.16 (risk of approx. 7.4%).
For the Select Sector SPDR Technology (XLK), investors should already be 50% long at $28.12 with a stop at $26.48. Add another 50% long position at $28.18 using the same stop.
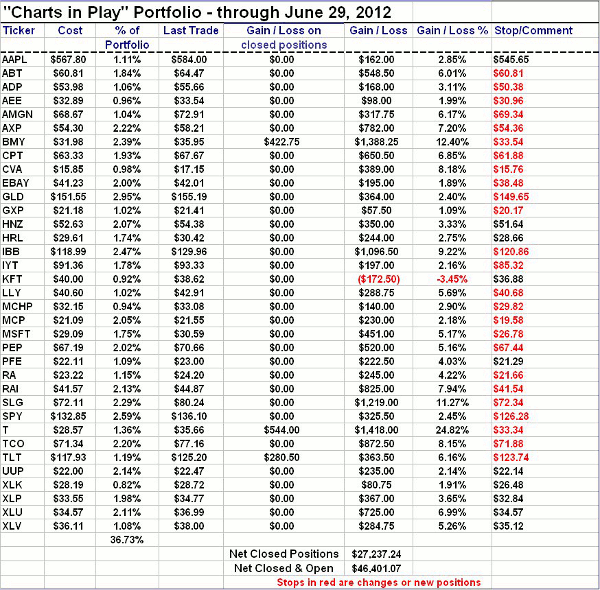
Portfolio Update: For the Select Sector SPDR Consumer Staples (XLP), investors should be 50% long at $33.80 and 50% long at $33.16, with a stop at $32.84.
For the Select Sector SPDR Health Care (XLV), investors should be 50% long at $36.04. Use a stop at $35.12.
For the Select Sector SPDR Utilities (XLU), investors should be 100% long at $34.57. Your stop should also be $34.57.
NEXT: See the Current “Charts in Play” Portfolio |pagebreak|


