After flashing bullish signs for several weeks, the overall market now appears ready for a more sustainable rally that could surprise the majority. Here are the signs to watch out for to confirm that stocks have begun a new intermediate term uptrend.
Thursday’s late-day reversal in stock prices was spurred primarily by nervous short covering as rumors spread over a new Euro debt deal. Stocks are sharply higher in early trading Friday in reaction to the overnight agreement to provide capitalization directly to the banks.
A solidly higher close Friday, the last trading day of the month and quarter, will further improve the technical outlook. At the early June lows, there were signs that fewer sellers were pushing prices lower. Over the past several weeks, the market’s ability to rebound repeatedly from early selling was also a sign of strength.
The bullish signs from the market internals in early June shifted my focus to the long side of the market and the Advance/Decline lines are now closer to giving strong intermediate-term buy signals. This could mean a dramatic stock rally that could last until the end of the year, which is a pattern we have seen in past election-year markets.
The technical action helped me to wonder on June 8, “Is A Buying Opportunity Around the Corner?" There have been some good opportunities to buy stocks as well as ETFs on the pullbacks over the past few weeks, but once the intermediate-term buy signals are confirmed there will still be plenty of time to buy.
I continue to favor a patient, risk-averse buying strategy. Let’s look at the improvement in the technical studies.
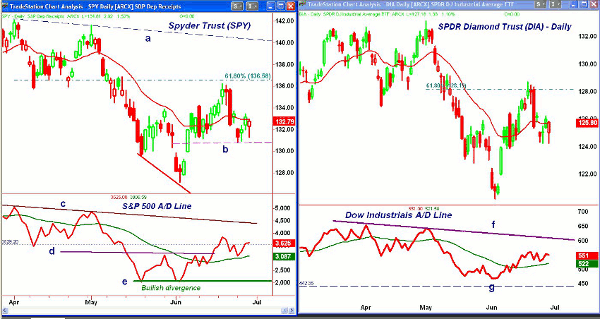
Chart Analysis: The Spyder Trust (SPY) had a fairly wide range Thursday, dropping as low as $131.28 before closing at $132.79.
- Earlier in the week, SPY dropped briefly below the $131 level (line b), which now represents first good support
- The next significant resistance is in the $135.19 to $136.25 area, with the major 61.8% Fibonacci retracement resistance following at $136.58
- The downtrend from the April-May highs (line a) is now in the $140.60 area
- The S&P 500 Advance/Decline line pulled back to its WMA early in the week, but it has now turned up
- A move in the A/D line above June 19 highs would be a further positive sign, and could happen by today’s close
- If the A/D line overcomes the long-term resistance (line c), it will signal that a new intermediate-term uptrend is underway
The SPDR Diamond Trust (DIA) also rallied sharply in late Thursday trading, but is still over 2% below the recent highs. On the rally from the June lows, DIA was stronger than the SPY, as it surpassed the 61.8% retracement at $128.17.
- DIA has next resistance at $127.31 to $128.71, with much stronger levels in the $129.60 to $130.30 area
- The Dow Industrials A/D line did not form a positive divergence at the lows, but did hold above stronger support (line g)
- The A/D line is holding above its slightly rising WMA, and is close to its recent highs
- The A/D line did form a negative divergence at the early May highs (line f), and this resistance must be overcome to confirm that the correction is over
- There is initial support now at $123.86 to $124.25
NEXT: More Key Levels to Watch
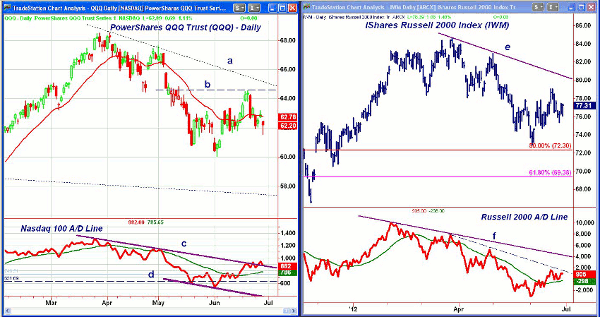
|pagebreak|The Powershares QQQ Trust (QQQ) made new lows for the week on Thursday, at $61.54, but did close well above the lows. There is next resistance at $63.18 to $63.50.
- There is still major resistance in the $64.50 to 64.80 area, which corresponds to the June highs (line b) and the downtrend (line a)
- The 61.8% Fibonacci retracement resistance, calculated from the April high at $68.55, is at $65.32
- The Nasdaq-100 did not form a positive divergence at the early June lows, line d, but has now overcome its key downtrend (line c)
- The ability to overcome this long-term resistance suggests that the Nasdaq-100 is stronger internally than the price action would indicate
- A move in the A/D line above the early May highs would be even more positive
The iShares Russell 2000 Index (IWM) has been the weakest of the four ETFs since March, but it did hold above the major 50% Fibonacci retracement support at $72.30, as its low was $72.94.
- The daily chart shows a short-term uptrend, with next resistance in the $79 area
- The downtrend from the March and April highs is in the $80 area, with major resistance between $82 and $84
- The Russell 2000 A/D line is holding above its WMA, but is still below its short-term downtrend (dashed line)
- The A/D line formed a significant negative divergence at the March highs (line f), and this resistance needs to overcome for the outlook to turn positive
- There is first good support in the $74.86 to $75.42 area
What it Means: Last week, I pointed out that both the Dow Jones Industrial Average and the Dow Jones Transportation Average had started new uptrends. I felt this was a positive for the overall market, but the correction from the June 19 highs was sharper than I expected.
This was probably the best entry opportunity in the Spyder Trust (SPY) for now, but I feel that for most individuals, stocks offer better risk as well as potential reward. In the coming weeks, I will continue to look for those market-leading stocks that have the most favorable volume patterns
How to Profit: On longs established this week in the Spyder Trust (SPY) and the iShares Dow Jones Transportation Average Index Fund (IYT), now is the time to adjust your stops.
For the Spyder Trust (SPY), investors should be 50% long at $133.22 and 50% long at $132.08. Use a stop now at $128.72.
For the iShares Dow Jones Transportation Average Index Fund (IYT), investors should be 50% long at $91.64 and 50% long at $90.88. Use a stop at $87.62.


