Savvy investors don’t need to rely on celestial phenomena for market rallies, because they use proven technical methods to determine entry points on stocks like the three recommended here.
Wednesday’s powerful gains had many in the financial media scrambling even before the markets closed to come up with an explanation why stocks were so strong.
Depending on your tolerance for the “talking heads,” their explanations were either humorous or mildly irritating. The Wisconsin elections were given the credit by one anchor, and I am sure the recent transit of Venus also got credit.
By late Wednesday and early Thursday morning, they explained that “hope” was the reason for the market’s rally. This was the combination of hope that the Federal Reserve would stimulate the economy and also hope that Europe would solve its problems.
Those who follow technical analysis believe that trying to explain sharp rallies or declines is often a fool’s game, because they generally reflect an imbalance between buyers and sellers.
As stocks dropped to new correction lows on Monday, there were several signs that there were fewer sellers then there were at the May 18 lows. For example, volume in the Spyder Trust (SPY) was 30% lower on Monday than it was at the May lows. More importantly, the advance/decline data also reflected that fewer stocks were declining Monday, even though the averages were making new lows.
Clearly, the latter stages of Wednesday’s rally were fueled by short covering, and I am sure there are still many nervous shorts now wondering where to place their stops. Of course, the positive divergences I highlighted before Wednesday’s opening do not tell you the magnitude of a rally, but likely upside targets can be determined using technical analysis.

The initial rally targets have already been reached, but further gains are likely before the market pauses. The confirmation of the positive divergences in the Advance/Decline lines is needed to confirm a significant low.
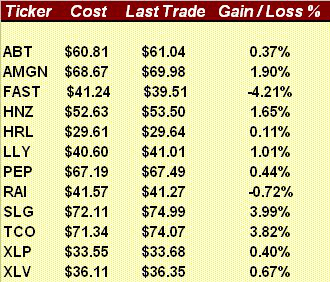
The table above list the stocks that have reached my technically identified buying zones in the past two weeks, and I will focus on three of them.
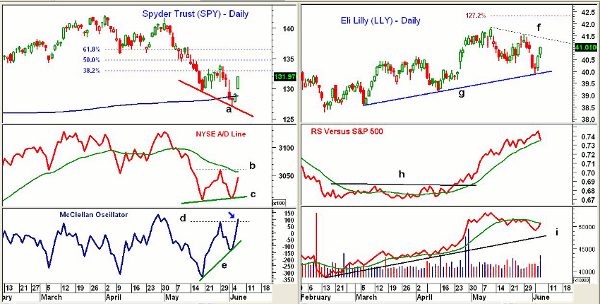
Chart Analysis: The Spyder Trust (SPY) gapped higher, closing just below the resistance in the $132 area. The 38.2% Fibonacci retracement resistance, calculated from the April highs, is at $133.
- A daily close above $133.93 (last week’s high) is the first requirement for starting a new uptrend
- The 50% retracement resistance is at $134.66
- The NYSE A/D line turned up sharply Wednesday, but is still below its WMA and resistance at line b
- The A/D line needs to overcome the resistance (line b) to confirm its positive divergence (line c)
- The McClellan oscillator closed at +99 Wednesday and confirmed the bullish divergence (line e), as resistance at line d was overcome
- There is initial support now between $128.80 and $130
Eli Lilly (LLY) tested the uptrend (line g) in the $40 area Monday, forming a doji. LLY is now back to first resistance in the $41 area.
- The downtrend (line f) is now in the $41.40 area. A break of this downtrend will signal a move to the 127.2% Fibonacci retracement target in the $42.35 area
- The relative performance, or RS analysis, did make new highs this week before turning lower
- The volume picked up Wednesday and was the highest in several weeks
- The on-balance volume (OBV) has turned up and has held well above its uptrend (line i). A strong move above its WMA will signal a new uptrend
- There is stronger support in the $39 to $39.50 area
NEXT: Precise Entry Points for Three Recommendations
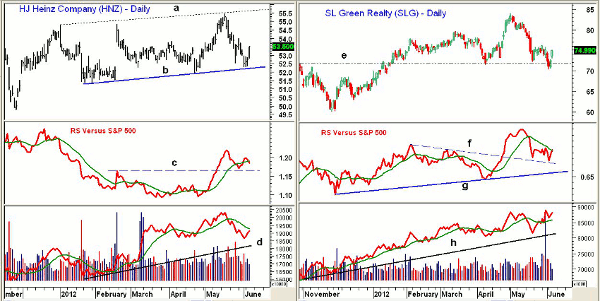
|pagebreak|HJ Heinz Company (HNZ) reached stronger support in the $52.29 area late last week and early this week (line a) before turning higher.
- There is next resistance at $54 to $54.40, with the upper boundary of the recent trading range in the $55.70 area
- The daily relative performance bottomed in early May, as it broke through resistance at line c
- The RS line has turned lower after making slightly lower lows
- The daily OBV has turned up and held well above its uptrend (line d)
- The OBV was stronger than prices in the middle of May
SL Green Realty (SLG) was featured last week in “2 Retail REITs with Surging Volume," as there was a huge spike in volume after it has dropped 16% from its May highs.
- SLG had a low Monday of $70.34, which was in the middle of its support zone (line e)
- SLG closed strong Wednesday, which should complete its correction
- There is initial resistance at $76 with stronger resistance around $77 to $78
- The RS line has turned up from support (line f), and appears to have held well above the long-term support at line g
- The daily OBV made new highs last week and is above its WMA and its uptrend (line h)
What it Means: The S&P futures are up another ten points before the release of the weekly jobless claims. The 38.2% resistance level for the futures is at 1,337, and more stops are likely resting above this level.
I would not recommend chasing the long side in the index tracking ETFs right now, but will be looking to buy on the next pullback, which should come next week. I will still look to do selective buying in individual stocks.
How to Profit: I’ll take this opportunity to adjust the risk on the three stocks that I featured today, and will publish a full portfolio list tomorrow.
Portfolio Update
For Eli Lilly and Co (LLY), investors should be 50% long at $40.52 (the second buying zone at $39.70 was not hit). Use a stop at $39.38.
For HJ Heinz Company (HNZ), investors should be 50% long at $52.74 and 50% long at $52.32, with a stop at $50.42. On a move above $55, raise the stop to $51.90.
For SL Green Realty (SLG), investors should be 50% long at $72.42 and 50% long at $71.66. Raise the stop to $68.88.


