Sharp volume spikes seen in these two retail REITs is a sign of bullish potential ahead, but given the vulnerable current state of the markets, it’s crucial to buy at risk-controlled entry points.
The afternoon rally on Thursday in the stock index futures made the close seem less worrisome, and the S&P futures closed almost ten points above the day’s lows. However, the selling resumed in overnight trading, and stock index futures were sharply lower and trading below Thursday’s lows. Weaker-than-expected manufacturing numbers from China added the European debt worries.
The technical studies are still pointing lower, but are currently well above the lows that were made on May 21. While this does allow for the formation of a positive divergence if the averages make lower lows, it also means that they are no longer extremely oversold.
Clearly, the market is focused on today’s monthly jobs report, which will be released after this article is completed and before the market opens. Many stocks that have been outperforming the S&P 500 have pulled back to major support, which allows for risk-controlled entry points.
Two retail REITs in particular look interesting, and both closed higher Thursday amid heavy volume, suggesting they are being accumulated. I would now look to buy them at slightly lower levels.
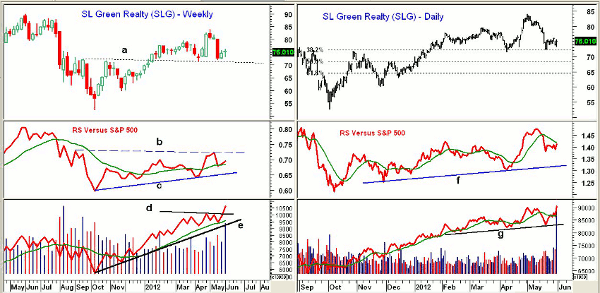
Chart Analysis: SL Green Realty (SLG) is a $6.7 billion retail REIT that yields 1.4% and has recently acquired several well-known buildings in New York. It peaked at $84 in early May and is now down over 16% from those highs.
- The weekly chart (left panel) shows that SLG is now very close to good weekly support, line a, in the $71 area
- There is additional chart support in the $68.50 area
- Relative performance, or RS analysis, has been in a gradual uptrend since last summer, line c
- The RS line has turned up from its weighted moving average (WMA) and a break through the resistance at line b would be very positive
- Weekly on-balance volume (OBV) broke out to the upside last week when it overcame resistance, line d
- Volume has been even stronger this week and the OBV now has good support at line e
The daily chart (right panel) for SL Green Realty (SLG) shows the steep slide from the recent highs, as the 38.2% Fibonacci retracement support from the October 2011 lows has been reached.
- The 50% retracement support level is at $68.40
- Relative performance broke through resistance in late April and shows a long-term positive pattern. Major support is at line f
- Daily OBV tested support in May, line g, but has since turned up sharply. Volume was four times the average on Thursday
- There is initial resistance at $76 with stronger resistance at $77-$78
NEXT: Another Promising REIT to Buy on a Slight Correction
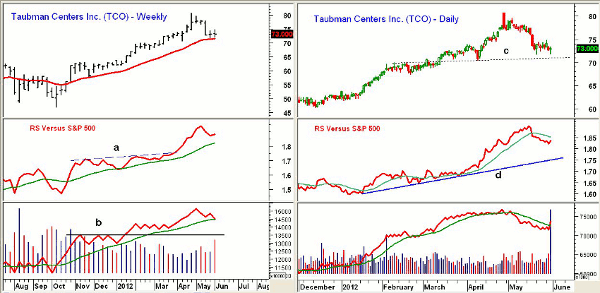
|pagebreak|Taubman Centers Inc. (TCO) is a $4.3 billion retail REIT that has a 12-year history of raising its dividend. From less than a dollar in 2000, the current dividend has risen to $1.85, which represents a current yield of 2.5%.
- TCO traded as high as $80.69 in late April but hit a low of $71.76 last week. This was a decline of 11% from the highs
- The 20-week exponential moving average (EMA) is now being tested, and further weekly support stands in the $70-$70.50 area
- Weekly RS line surged to significant new highs in May, confirming the price action. It is now well above its rising weighted moving average
- RS line broke out earlier in the year when resistance at line a was overcome
- Weekly OBV is now testing its weighted moving average but staged an impressive breakout through resistance, line b, in early 2012
The daily chart (right panel) of Taubman Centers Inc. (TCO) shows that it is now approaching good support in the $70.50-$70.80 area.
- TCO made a low in February of $67.40, which is now an important level of support
- Daily RS line peaked in mid-May and has now dropped below its weighted moving average
- Relative performance shows a positive longer-term uptrend, line f
- Volume on Thursday was 2.3 million shares, which was almost five times the average volume of 500,000
- Minor support lies at $72 with stronger support at $67.50-$69
What It Means: Sharply higher volume in these two retail REITs after both tested more important support suggests accumulation. The relative performance analysis suggests that both have been outperforming the S&P 500.
Given the negative short-term outlook for the overall stock market, however, I would only recommend buying at slightly lower levels where the risk/reward is more attractive.
How to Profit: For SL Green Realty (SLG), go 50% long at $72.42 and 50% long at $71.66 with a stop at $67.88 (risk of 5.7%). On a move above $77.55, raise the stop to $71.88.
For Taubman Centers Inc. (TCO), go 50% long at $71.62 and 50% long at $70.80 with a stop at $67.26 (risk of 5.5%). On a move above $75.15, raise the stop to $71.44.
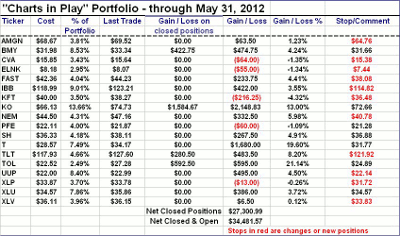
NEXT: View the Complete "Charts in Play" Portfolio
|pagebreak|


