Investors shouldn’t let this year’s hot start—the best since 1998—make them buy and forget, especially since crisis suddenly struck and stocks collapsed that same year.
Much has been made in the press recently about stocks putting in the best first-quarter performance since 1998. Many readers may not remember the first half of 1998, but may be more likely to recall the Russian ruble crisis in July 1998 and the ensuing collapse in the fall of hedge fund Long-Term Capital Management (LTCM).
For those who don’t recall, this past meltdown has some eerie similarities to our more recent financial crisis. Warren Buffett, along with Goldman Sachs (GS), initially offered $3.75 billion for the fund, which had been worth $4.7 billion, but he reportedly only gave them an hour to decide on the buyout.
In the end, the final rescue group included Goldman Sachs and many of the world’s large money center banks, along with Lehman Brothers. Bear Stearns declined to participate and was saved from failing in 2008. To learn more about the 1998 crisis, click here.
Though I have never been convinced that comparative periods of performance have any predictive value, I think comparing chart patterns from different historical time frames can improve our perspective. Often times, they will alert investors to the potential for market developments that they may not have considered.
As a result, let’s look at what transpired in 1998 and relate it to the current technical outlook for the stock market.
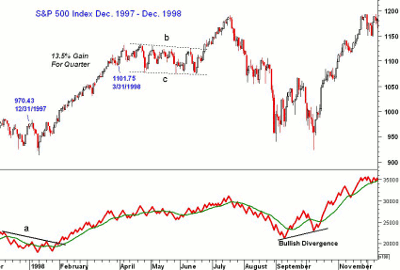
Chart Analysis: This daily chart of the S&P 500 covers all of 1998 and shows that it closed 1997 at 970.43. In 1998, the S&P 500 dropped to a further low in January at 912.83 before starting its dramatic rally.
- The S&P 500 closed the quarter at 101.75, posting a gain of 13.5%
- On-balance volume (OBV) did a good job of catching the first quarter strength, as it broke its downtrend, line a, in early February and stayed above its rising weighted moving average (WMA)
- In April 1998, stocks made further new highs at 1132.98 before starting a three-month trading range, lines b and c
- This continuation pattern was resolved to the upside when the S&P 500 hit a high of 1190.75 on July 20
- As fears about a collapse in the Russian ruble spread, stocks dropped and did not bottom until October when LTCM was rescued. By that time, the S&P 500 had fallen more than 22% from its highs
NEXT: Current Chart Pattern for the S&P 500
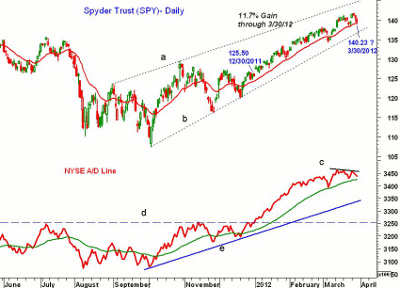
|pagebreak|The latest daily chart for the Spyder Trust (SPY) shows the powerful first-quarter rally, which has taken SPY 11.7% higher (through Thursday’s close) for the quarter. Though this is well behind the 13.5% gain in 1998, it has clearly been a record-setting performance.
- SPY dropped briefly below the rising 20-day exponential moving average (EMA) Thursday at $139.19 before rebounding into the close
- On a move above the recent highs at $141.83, the next targets are in the $142.50-$143 area
- The upper trend line resistance, line a, is in the $145 area
- There is key support now from March 23 at $138.55, which, if broken, would increase the odds that the uptrend (line b) or the early-March lows will be tested
- The NYSE Advance/Decline (A/D) line shows the major breakout in early 2012 (line c), which supports a bullish intermediate-term outlook for the stock market
- The A/D line has formed a short-term negative divergence, line b, which could be overcome with a day of two-to-one or better A/D numbers
- A drop in the A/D line below the recent lows and its weighted moving average will signal a deeper correction
- There is long-term A/D line support at line d
What It Means: The 1998 S&P 500 chart should be a reminder to investors that after such a dramatic rally, the possibility for a three-month period of sideways trading can’t be ruled out. The sharp drop in the summer and fall of 1998 also reinforces the importance of using stops, because unforeseen events can hit the market at any time.
Though the current technical outlook reveals some deterioration in the broad NYSE A/D line, this could be overcome with a strong close on Friday. It is also possible that SPY will simply stay in the $138.50-$142 trading range for another week or more. A close below $138 would signal a more significant correction, however.
How to Profit: I recommend that investors continue to raise stops on long positions in order to lock in some profits. Any position that has been open for a month or longer should be watched carefully and should not be allowed to go much below the entry level. If the stock market again breaks out to new highs, look to raise some cash.


