Many have held out hope for gold mining stocks, but negative technical signals actually warned of this week's high-volume decline, and it seems more underperformance is ahead.
The gold miners were hit very hard on Wednesday, and the widely watched Market Vectors Gold Miners ETF (GDX) was down 3.8%. For much of 2011, many investors and analysts have hoped that the mining stocks would finally catch up with gold prices and the primary gold ETF, the SPDR Gold Trust (GLD).
Of course, hope is not a good investment strategy, and the technical readings for gold mining stocks have turned more negative in the past month. The heavy volume on the decline suggests that these miners are likely to drop even further.
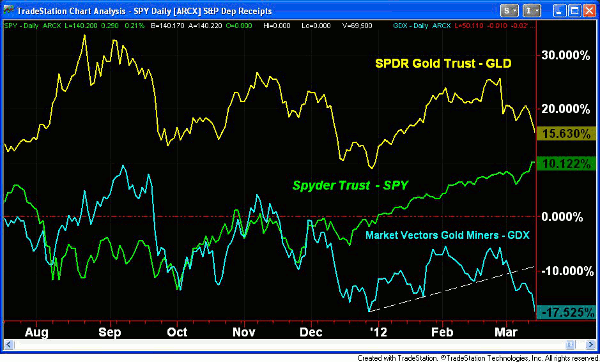
This comparative performance chart reflects the percentage change since the start of 2011. The SPDR Gold Trust (GLD) is currently up 15.6% but down sharply from last August's peak gain of 33%. It is also down 10% from the late-February high.
The Spyder Trust (SPY) is up just over 10% for the same time period, while the Market Vectors Gold Miners ETF (GDX) is down 17.5% and has been in negative territory since last November. The break of its uptrend in early March indicated that the performance of the gold miners was likely to get worse.
The relatively high yield offered by select gold miners has tempted some investors, but the potential for another 8%-10% drop means that even a 2%-3% yield is not great. Also, the relative performance analysis suggests these stocks will continue to underperform the S&P 500, and actually warned of the current drop more than a week ago.
NEXT: See Latest Technical Outlook for Gold Miners ETF |pagebreak|
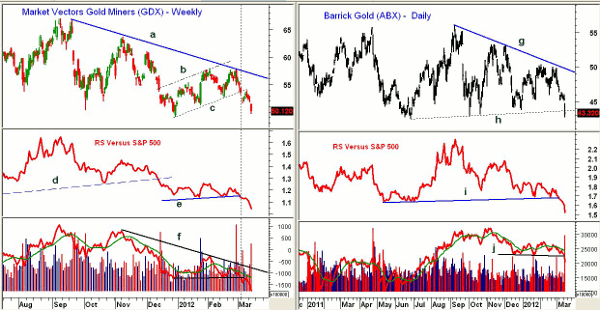
Chart Analysis: The daily chart of the Market
Vectors Gold Miners ETF (GDX) shows that it completed its continuation pattern, lines b
and c, on March 2.
- The initial downside target from the flag formation is in the $48 area with Fibonacci retracement
targets at $46.80
- The major 38.2% support is at $47.40 with the 50% Fibonacci retracement support at $41.40
- Relative performance, or RS analysis, broke major support, line d, in December, which
forecasted further weakness. Similar signals in some of the big banks in early
2011 preceded their sharp declines as well
- On March 1, I warned that "A break below the RS line's recent lows will
warn of a sharper decline." This support (line e) was broken on March 2
- Daily on-balance volume (OBV) reveals a longer-term pattern of
lower highs, line f, and it dropped to new lows over a week ago when support
was broken
- There is initial resistance now at $52.50 with stronger resistance at
$54.80-$55.20
Barrick Gold (ABX) is a $43.3 billion Toronto-based gold mining company that currently yields 1.3%. ABX traded as high as $55.95 last September. It is now down 22.6% from this high.
- Wednesday's close was below the ten-month support at line h. Therefore,
everyone who bought ABX since 2011 is at a loss
- The major 38.2% Fibonacci support stands at $40.99 with the 50% support at
$36.46
- Daily RS analysis broke its support, line i, last week, and has a very
negative pattern
- The weekly RS line (not shown) has also broken major support
- At 22 million shares, yesterday's volume was three times the daily
average
- Daily OBV has been below its weighted moving average (WMA) since late
February and has now broken support at line j
- Initial resistance is at $45.60 with stronger resistance at
$47.60-$48
NEXT: Another Big Gold Miner That Looks Vulnerable
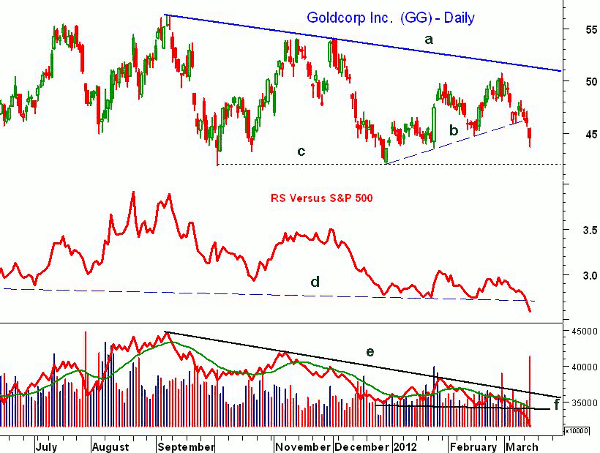
|pagebreak|Goldcorp Inc. (GG) is a $36 billion Vancouver-based gold mining company that yields 1.2%. It peaked at $56.31 on September 8 and is now down 21% from its high.
- The daily chart shows that GG closed below its uptrend, line b, on
Tuesday. There is next support in the $43 area, line c
- The 38.2% Fibonacci retracement support is at $40 with the 50% support at
$35.04
- The RS line has already dropped to new lows, line d, suggesting that price
support will also be broken
- Volume on Wednesday was double the daily average, and the OBV dropped
below key support, line f, last week. It is now leading prices lower
- There is first resistance now at $45.50-$46 with much stronger resistance
in the $48 area
What It Means: The sharp decline in gold prices on February 29 strongly suggested that it was the start of a deeper correction. The daily outlook is still negative for gold, and a drop to the $1500-$1450 area is possible.
The monthly analysis remains positive for gold futures and the SPDR Gold Trust (GLD), indicating that the current decline will eventually be followed by a move to new highs.
The gold miners continue to act much weaker, and another 5%-10% drop is likely over the next month or so. Barrick Gold (ABX) could drop to the $39-$41 area, while Goldcorp Inc. (GG) could test the $40-$41 area.
How to Profit: My advice for the gold miners has not changed much since last October, when I commented "The gold miners look quite vulnerable, and if you are long any of the individual mining stocks, be sure your protective stops are in place."
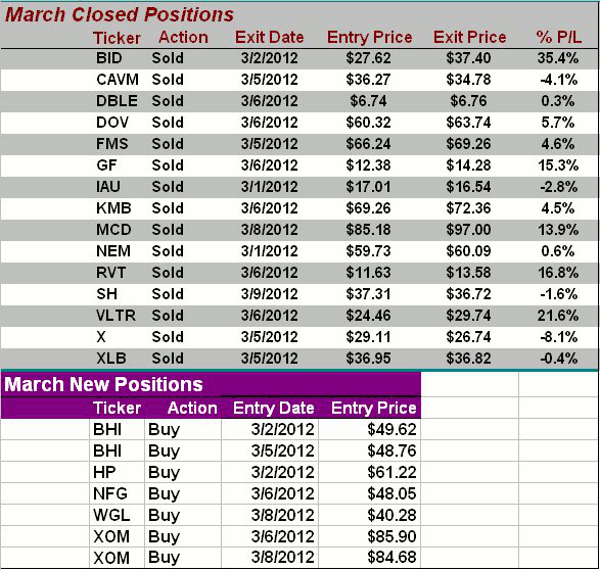
In January, however, I recommended Newmont Mining Corp. (NEM) when it appeared that gold had started a major new uptrend. By early March, it was clear I was wrong, and I quickly advised closing out the position for a small profit.
NEXT: See Latest Changes to Charts in Play Portfolio
|pagebreak|


