Small-cap stocks have assumed a leadership role over the broader markets, and while a deeper, news-inspired correction could still unfold, the mid-term trend remains positive.
Early selling on Monday and the additional pressure on stocks seen Tuesday in reaction to disappointing economic news may have been enough of the “bad news” I have been looking for since last week. The American Association of Individual Investors (AAII) sentiment survey shows that the bullish percentage dropped from 48.4% to 43.8% while the number of bears jumped by 6%.
Wednesday’s ADP employment report showed a steady increase in jobs, although it was down significantly from last month. The market seems to be holding its breath ahead of Friday’s monthly jobs report.
Despite the impressive rally from the October lows and January’s strong gains, there are still a number of analysts who label themselves as “intermediate-term bears.” This is a good thing, and so too were the articles in early January warning that the rally was a bull trap.
Though a drop below Monday’s lows would suggest a deeper and more complex correction, the analysis of the Advance/Decline (A/D) lines for the major averages is still positive for the intermediate term.
The new leadership role of the small-cap stocks, as measured by either the iShares Russell 2000 Index Fund (IWM) or the iShares S&P SmallCap 600 Growth Index Fund (IJT) is also a positive sign. These small-cap indices were up over 2% on Wednesday as compared to a less-than-1% gain in the S&P 500.
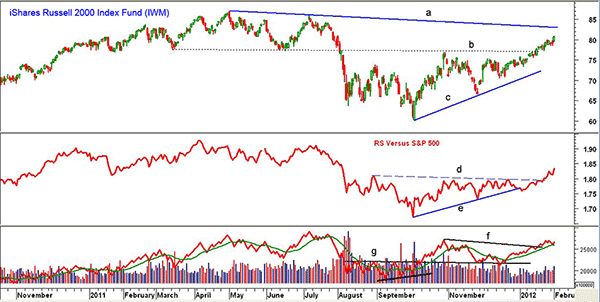
Chart Analysis: The daily chart of the iShares Russell 2000 Index Fund (IWM) was finally able to overcome the 61.8% Fibonacci retracement from the April 2011 highs on January 18. Wednesday’s close above the $80 level indicates a test of chart resistance in the $83 area, line a.
- IWM made highs of $85.97 in July and $86.81 in April. The high in 2007 was $85.74
- The break through the resistance at line d has turned the relative performance, or RS analysis, positive, thus indicating that small caps are outperforming the S&P 500
- The break of the uptrend, line e, in late 2011 was indeed a fake out
- Weekly RS analysis (not shown) is also now positive
- Daily on-balance volume (OBV) completed its bottom formation in October when it moved through initial resistance (line g) after failing to confirm the lows. This resistance (now support) was retested in December
- The OBV has now moved through the new resistance, line e, confirming the price action
- Initial support for IWM now stands in the $78.50-$77.50 area
NEXT: Latest Chart Patterns for Nasdaq, S&P 500 ETFs; How to Profit
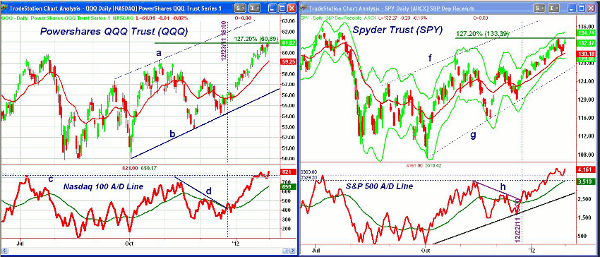
|pagebreak|The PowerShares QQQ Trust (QQQ) overcame the 127.2% Fibonacci price projection target at $60.89 on Wednesday as well as the equality target at $60.54 that was derived using the 2002-2007 rally.
- The upper trend line resistance, line a, is now in the $63.60 area
- The Nasdaq 100 A/D line broke its downtrend, line d, on December 23 and then surpassed the July highs (line c) last week
- After a slight pullback, the A/D line has again turned higher. It is well above its rising weighted moving average (WMA)
- There is now initial support for QQQ at $60.30 with further support at $59.25-$59.50 and the rising 20-day exponential moving average (EMA - in red)
The Spyder Trust (SPY) has tested its 127.2% Fibonacci price target at $133.39 (the high on Jan. 26 was $133.40) but has not closed above it.
- The next major hurdle for SPY is the 2011 high at $137.18, followed by the 78.6% retracement resistance at $138.26
- The upper trend line, line f, is currently at $139.40
- The rising 20-day EMA was almost reached on Monday and is now at $130.18. A close below Monday’s low at $130.06 will suggest a drop to the $128.30-$127.20 area. The daily Starc- band is at $129.06
- The S&P 500 A/D line moved through its downtrend, line h, on December 22, signaling the recent rally
- The A/D line moved to new all-time highs last week and after a brief pullback has turned up once more. It would take a day of strongly negative breadth to turn it negative on a short-term basis
What It Means: The futures were trading a bit higher early Thursday and a daily close above last week’s highs (SPY: $133.40; S&P 500: 1334) will signal acceleration on the upside.
The action of the iShares Russell 2000 Index Fund (IWM) indicates that buying small-cap industrial or material stock on pullbacks to support should be a good strategy. (See also “Fortify Your Portfolio with Steel.”)
How to Profit: Buyers who established positions in two small-cap ETFs and one closed-end small-cap fund as recommended here now simply need to adjust the stop levels.
Portfolio Update
Buyers went 50% long the iShares Russell 2000 Index Fund (IWM) at $68.72 and 50% long at $66.88 (average price of $67.80). Half the position was sold at $74.68 on December 28. Raise the stop to $76.68 on the remaining position.
Buyers should be 50% long the iShares S&P SmallCap 600 Growth Index Fund (IJT) at $68.64. Raise the stop further to $76.72 on the open position.
Buyers should be 50% long the Royce Value Trust (RVT) at $11.62. It gapped higher on Wednesday (Feb. 1), closing at $13.72. Raise the stop further to $12.56.
Buyers should be 50% long Volterra Semiconductor Corporation (VLTR) at $21.64. Raise the stop to $25.77 and sell half the position at $32.86 or better.
Buyers should now be 50% long Double Eagle Petroleum (DBLE) at $6.88 and 50% long at $6.56. Yesterday’s low was at $6.48, which was the suggested stop level. For those who were not stopped out, it is now at daily Starc- band, so lower the stop to $6.47 and sell at $6.76 or better.
Also, cancel any unfilled orders in the following stocks: WESCO International (WCC), Energy XXI Limited (EXXI), Mentor Graphics (MENT), Pacer International (PACR), and East-West Bancorp, Inc. (EWBC).


