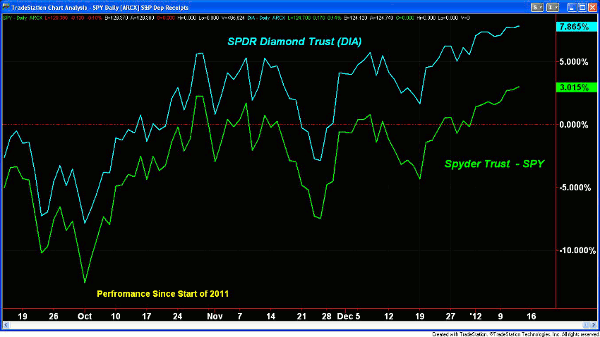
Big Dow stocks handily outperformed in 2011, but recent action in the Advance/Decline (A/D) line suggests the Dow could be more vulnerable on a correction than the now-lagging S&P 500.
With JPMorgan Chase (JPM) set to report earnings before Friday’s open, the stock market is getting ready for next week’s heavy schedule of earnings reports. Many Dow components are scheduled to report next week, including International Business Machines (IBM), Microsoft (MSFT), and Intel (INTC), which are all scheduled for Thursday, January 19.
The Dow Industrials clearly outperformed the S&P 500 in 2011, but so far in 2012, the Spyder Trust (SPY), which tracks the S&P 500, has done about 1% better than the SPDR Diamonds Trust (DIA), which follows the Dow Industrials. But do the market internals and other technical factors favor one index over the other as we enter 2012?
Chart Analysis: This percentage change chart (courtesy of TradeStation.com) shows the performance of the SPDR Diamonds Trust (DIA) and Spyder Trust (SPY) since the start of 2011.
- DIA is now up just about 7.87% during this period, though it was up 10% in July. The highest gain (10.8%) occurred in May
- Thanks to the strong performance so far in 2012, SPY is now up just over 3%. It achieved a maximum gain of 8.5% in April 2011
NEXT: Daily Charts of These Primary Dow, S&P 500 ETFs Compared
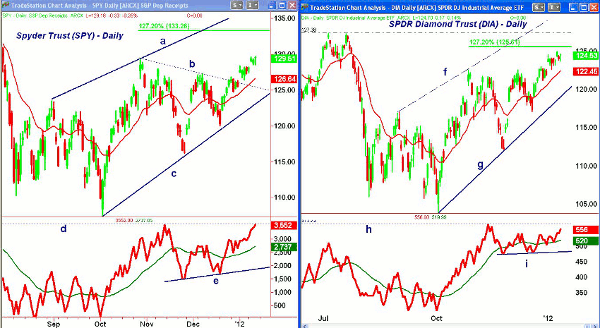
|pagebreak|The daily chart of the Spyder Trust (SPY) shows the gap through resistance (line b) at the start of the year. The October 27 high at $129.42 was just overcome on Thursday.
- The 127.2% Fibonacci retracement target is at $133.26 with resistance from the July highs at $134.70-$135.70
- The S&P 500 Advance/Decline (A/D) line moved above its weighted moving average (WMA) on December 22 and has been rising nicely since
- The A/D line has not yet exceeded the previous high, line d, which is a short-term concern
- In a very strong rally, the A/D line should be acting stronger than prices. A drop back to the rising weighted moving average would not be surprising
- The important A/D line support is now at line d
- The rising 20-period exponential moving average (EMA) is now at $126.60 with more important support at $124.73-$125
The SPDR Diamonds Trust (DIA) surpassed the October highs on the first day of the New Year. It is now not far below the 127.2% Fibonacci retracement target at $125.61.
- The July highs are at $127.30, and DIA reached $128.63 on May 6, 2011
- The upper trend line on the daily chart, line f, is at $130.40
- The Dow Industrials’ A/D line is still well below the prior highs and the weighted moving average is now just starting to turn higher
- This is quite different than the action after the October lows when the Dow’s A/D line was rising more sharply than that of the S&P 500
- There is first support for DIA at the 20-day EMA in the $122.40-$122.60 area. There is additional support now at $120.50
What It Means: The lagging action of the A/D lines for both the S&P 500 and Dow Industrials is consistent with a short-term top. It would take a few days of strong Advance/Decline numbers to reverse this deterioration.
The short-term comparison of the two A/D lines suggests that the Dow stocks may be more vulnerable on a market correction. I would not be surprised to see the cash S&P 500 hit the 1305-1310 area and SPY reach $130.50-$131.50 before a pullback.
After a correction, I will be better able to assess the weekly relative performance, or RS analysis, which still favors DIA at this time.
How to Profit: A 2%-4% correction in the Dow would not be surprising, so those who have nice profits on some of their Dow stocks and are familiar with covered call strategies may want to sell higher-strike calls against their existing stock portfolio, especially if the S&P 500 gets above 1304.


