History proves that copper typically rises in the opening months of the year, and buyers should look to a particular copper ETN and stock to capitalize if the theme holds true again this year.
The copper market is watched closely as a barometer of the economy’s health and copper futures been active so far this week. The recent report that China’s imports of copper in December hit record levels has also caught many analysts’ attention even though some of the increase has been attributed to arbitrage in the futures market. The recent decline in China’s inflation rate is also an encouraging sign.
Also bullish was a forecast from Alcoa (AA) expecting Chinese imports of copper to rise by 12% in 2012. John Person, an expert is seasonal commodity patterns, mentioned to me last month that we were entering a typically bullish period for copper prices.
See also: The 4 Key Seasonal Trends for 2012
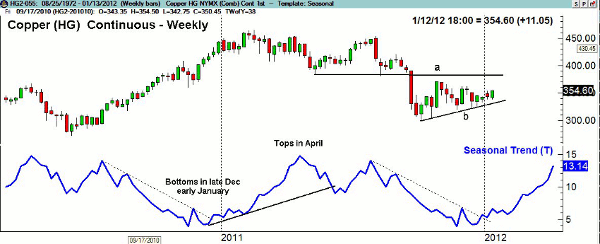
My analysis of the seasonal trend for copper futures (courtesy of Trade Navigator) does suggest that now is the time to be watching copper prices as well as a popular ETN and copper stock.
Chart Analysis: The weekly chart of the high-grade copper futures shows an uptrend from the October lows, line b. A close above the early-December highs in the March contract at $3.655 per pound would be a positive sign.
- There is further resistance at $3.770, line a
- The seasonal trend analysis dating back about 20 years reveals that prices typically turn higher in late December or early January (see broken downtrend)
- The initial peak generally comes in April, followed by a secondary high in July, which precedes a decline for the rest of the year
- There is key support for the March futures contract at $3.210-$3.230
NEXT: 2 Ways to Play Copper’s Seasonal Strength
|pagebreak|The iPath DJ-UBS Copper Total Return Sub-Index ETN (JJC) is the most liquid of the exchange traded products that follow copper prices. It has assets of approximately $123 million and an expense ratio of 0.75%.
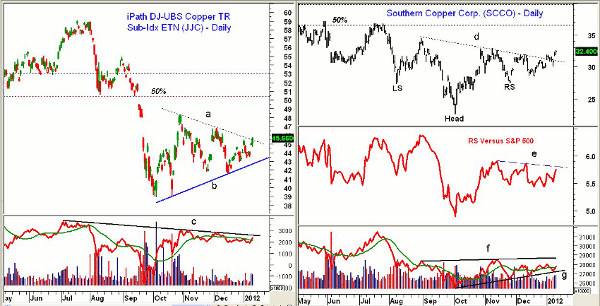
- JJC hit a high last July at $59.06 and found support in the $39 area last October
- Wednesday’s close was just barely above the short-term downtrend, line a, with further resistance at $46.80
- The 50% Fibonacci retracement resistance level is at $50.40
- The flag formation (lines a and b) is more consistent with a continuation pattern or an interruption in the downtrend
- Therefore, higher prices need to be confirmed by a surge in volume, as the daily on-balance volume (OBV) is still below resistance from last July, line c
- The OBV is well above the lows formed in October
- There is now first support for JJC at $42.80-$43.40 and the uptrend, line b
Southern Copper Corporation (SCCO) engages in copper mining, exploration, and smelting in Peru, Chile, and Mexico. The company has been plagued by strikes over the past few years, but SCCO does pay a current yield of 9.0%. The dividend has fluctuated over the past 15 years.
- The daily chart shows that SCCO completed a reverse head-and-shoulders bottom formation, closing above the neckline (line d) last week
- The breakout level was tested before this week’s high prices
- On the chart, I have identified the left shoulder (LS), head, and right shoulder (RS)
- The 50% Fibonacci retracement resistance from the early-2011 highs at $50.07 is at $36.60
- In this week’s Trading Lesson, I will explain how to calculate the upside target from this formation, which is at $42
- The relative performance, or RS analysis, has failed to confirm the breakout, as it is still below the resistance at line e
- The OBV is still locked in a trading range, lines f and g. It needs to break out to the upside to confirm the price action
- There is initial support now at $29.80-$30.20 with key support at $27.50
What It Means: The copper market will bear close watching over the next month or so, and if it can confirm a new uptrend corresponding to the positive seasonal bias, it will have implications for many markets.
The failure of the volume to confirm the price action has me cautious on both JJC and SCCO, but the high current yield of SCCO makes it an attractive buy at stronger support.
How to Profit: For Southern Copper (SCCO), go 50% long at $30.28 and 50% long at $29.76 with a stop at $27.38 (risk of approx. 8.8%). On a move above $33.56, raise the stop to $29.76.


