A proven combination of technical methods that successfully identified the strongest and weakest sectors in 2011 is applied to discern where the best buying opportunities will appear in 2012.
The sector performance in 2011 further illustrates the year’s volatility. Many sectors had a few strong quarters, but the yearly performance numbers do not reflect the wide price swings. Since the S&P 500 and its tracking ETF, the Spyder Trust (SPY), were essentially flat for the year, all the other Select Sector SPDR ETFs except for Financials (XLF), Materials (XLB), and Industrials (XLI), performed better.
As the table below indicates, the swings in the Select Sector SPDR - Energy (XLE) were probably the most dramatic. XLE had the two best quarters, as it was up 16.8% in the first quarter and up 21.8% in the fourth quarter. However, due to the 22.3% drop in the third quarter, XLE was only up 1.3% for the year. If it wasn’t for the strong fourth quarter, the yearly numbers would have been much worse for all of the sectors.
The Select Sector SPDR - Utilities (XLU) was the star performer in 2011, up 14.8% while both the Select Sector SPDR - Consumer Staples (XLP) and Select Sector SPDR - Health Care (XLV) both gained over 10% for the year. All are considered defensive sector ETFs, so in hindsight, this should have not been a surprise. Health care was a favored destination starting in early 2011, but it would have been nice to have avoided the 10.7% drop in the third quarter.
It is no surprise that the Select Sector SPDR - Financial (XLF) was the worst performer, down 18.5% for the year, and the second worst performance was the 12.8% decline in the Select Sector SPDR - Materials (XLB). The relative performance, or RS analysis, kept us pretty much out of these two sectors, but the question now is regarding where the opportunities will be in 2012?
NEXT: Will 2011's Standout Sector Shine Again?
|pagebreak|Chart Analysis: The weekly chart of the Select Sector SPDR - Utilities (XLU) looks ready to reverse this week and close lower. This suggests that it may decline further next week.
- There is good weekly support, line a, in the $34.22-$34.30 area with more important support at $33.18, which was the November low
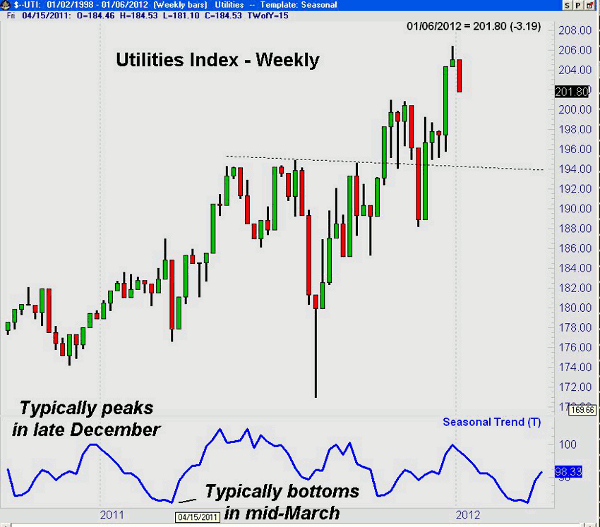
- Seasonal trend analysis reveals that the utilities sector and XLU typically top in late December and bottom in March
- The rally from a March low typically tops in June with the next major low in October
- The weekly RS line (not shown) will drop below its weighted moving average (WMA) this week and the weekly on-balance volume (OBV) failed to confirm last week’s highs
- Resistance for XLU now stands at $36
NEXT: The Most Attractive Sector ETF for New Buying
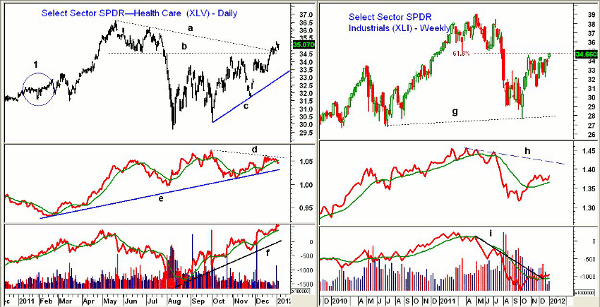
|pagebreak|The daily chart of the Select Sector SPDR - Health Care (XLV) broke through converging resistance (lines a and b) in the latter part of December. The daily chart shows a pattern of higher highs.
- XLU has further resistance at $36 and $36.44 with the weekly Starc+ band at $36.25
- Relative performance has formed lower highs, line d, and has not confirmed the price action
- A drop below the December lows and the uptrend (line e) will suggest that XLV is starting to underperform the S&P 500
- The daily OBV looks much stronger, as it made new highs and has good support at line f
- Weekly RS and OBV (not shown) look much stronger as well
- There is initial support at $34.30 with the uptrend (line c) and the 38.2% Fibonacci retracement support at $33.25
The Select Sector SPDR - Industrials (XLI) was down 3.2% and was the third-worst performer in 2011. XLI had a great fourth quarter, gaining 16.6% and rallying back to the major 61.8% Fibonacci retracement resistance at $34.70.
- There is stronger resistance and the weekly Starc+ band just above $37. The July high was at $38.43
- RS analysis formed a divergence at the April high (line h) and completed a top in May
- The weekly RS now appears to have bottomed out, as it has moved above its rising weighted moving average
- Weekly OBV also appears to have bottomed, but that signal is not quite as strong. It has broken its downtrend, line i, and is above its weighted moving average while lagging the price action
- There is first support for XLI at $33.40-$33.80 with stronger support at $32.60
What It Means: Though we may not see as many wild price swings in major sectors this year, careful sector analysis is likely to make a big difference in your portfolio performance.
I continue to think that the combination of RS and OBV analysis on both the weekly and daily data is the best way to identify the strongest and weakest sectors. When this analysis agrees with the seasonal tendencies, the odds become shifted even more in the investor’s favor.
Two of the strongest sector ETFs, the Select Sector SPDR - Utilities (XLU) and Select Sector SPDR - Health Care (XLV) look ready for a pullback as money may begin flowing into less-defensive sectors. This may also be true for the Select Sector SPDR - Consumer Staples (XLP).
Currently, the most attractive sector ETF for new buying is the Select Sector SPDR - Industrials (XLI), and that helps to explain why my recent Dow Portfolio is doing so well.
How to Profit: For the Select Sector SPDR - Industrials (XLI), go 50% long at $34.14 and 50% long at $33.62 with a stop at $31.88 (risk of approx. 5.9%).
Portfolio Update
For the Select Sector SPDR - Utilities (XLU), buyers should be 50% long at $34.86 and 50% long at $34.52. Use a stop at $33.08.
As recommended in mid-August, investors should be 50% long the Select Sector SPDR - Consumer Staples (XLP) at $29.08 and 50% long at $28.88. Use a stop at $31.18 and sell half the position at $33 or better.
For the Select Sector SPDR - Technology (XLK), buyers should be 50% long at $23.66 and 50% long at $23.12. Use a stop now at $24.48.


