The completion of a developing chart pattern in this key bond ETF could decidedly shift the outlook for the stock market in the weeks ahead.
The bond bull market of 2011 is likely to be remembered for many years. The buying frenzy both in the US and overseas started early in 2011, and who would have expected the sale of MIT’s 100-year bonds to be oversubscribed?
The summer spike highs in the bond market did suggest a top was being formed, but after the initial round of selling, bonds have held up quite well. The technical patterns for the longer-term instruments can be interpreted as continuation patterns that would be resolved by another push higher in prices and a push lower in yields.
This is also the most likely scenario when looking at the long-term yield charts of the ten-year T-notes. The shorter-term instruments look more negative, while junk bonds look even more vulnerable.
For most, it is the liquid bond ETFs that can offer opportunities for investors and traders, and over the coming weeks, these funds should be watched closely.
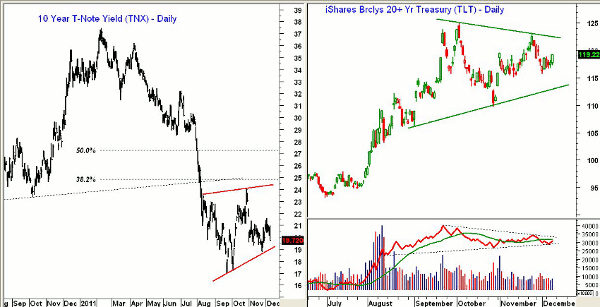
Chart Analysis: The long-term chart of the yields on ten-year T-notes shows that on September 22, yields hit a low of 1.69%. Yields rebounded in late October, moving back to a high of 2.40% while stocks were also making highs.
- The October highs form the upper boundary of a flag formation, lines b and c
- Long-term support that connects the 2008 and 2010 lows, line a, was violated in August, which is negative for the intermediate term
- The rebound has so far has fallen well short of the 38.2% Fibonacci retracement resistance at 2.48%
- There is key support now at 1.88% and the downside projections from the flag formation are as low as the 1.28%-1.32% area
The iShares Barclays 20+ Year Treasury Bond ETF (TLT) hit a high of $125.03 on October 4 before reversing sharply. TLT hit a low in late October of $114.07 and has since rallied strongly. It has a current yield of 3.38%.
- Daily chart now shows a flag, or triangle formation, lines d and e. TLT closed higher on Thursday, but a close above $122.58 is needed to complete the formation
- The Fibonacci target from the flag formation is at $129.60 while the chart formation targets are much higher (see “Using Fibonacci to Trade Flag Patterns”)
- Daily on-balance volume (OBV) has formed a very slight negative divergence at the highs (line f) but has just turned back after testing support at line g
- A strong move above the November highs will suggest an upside breakout in TLT
- Weekly OBV (not shown) did confirm the September highs and is just slightly below its rising weighted moving average (WMA)
- There is minor support now at $117.50-$118.20 with stronger support at $115.80. A close below $114.07 would invalidate the flag formation
NEXT: Short-Term T-Bonds and a Top Corporate Bond ETF
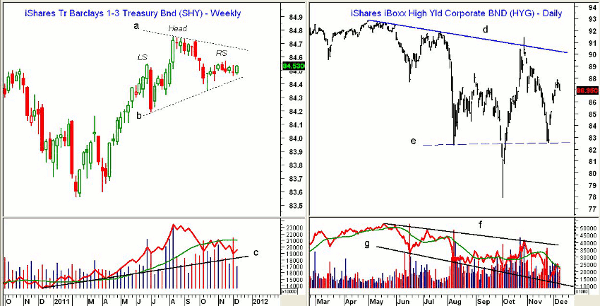
|pagebreak|The weekly chart of the iShares Barclays 1-3 Treasury Bond Fund (SHY) has two viable interpretations, in my opinion. SHY peaked in August at $84.75 and corrected as low as $84.35 in October.
- The weekly OBV confirmed the August highs, so a flag formation (lines a and b) is the most likely chart interpretation
- A move above the recent highs at $84.57 will signal a test of the downtrend, line a. A completion of the flag formation has targets at $85.20
- Even though the volume pattern does not fit, we could make the case for a potential head-and-shoulders top formation with the left shoulder (LS) having formed in June, the head in August, and the right shoulder (RS) in November
- This would make the neckline (line b) at $84.44 the key level to watch. More important support stands at the October lows
- Weekly OBV is below its flat weighted moving average but is still holding above long-term support at line c
The daily chart of the iShares iBoxx High-Yield Corporate Bond ETF (HYG) shows how volatile this ETF has been since March, making a high of $92.85 and an October low of $77.90.
- The late-October rally took HYG briefly above the daily downtrend, line d, before it reversed
- The rebound from the November lows ($82.53) appears to have failed below $88. There is next support at $85-$85.54
- A break below the $82.50 level, line e, would be much more negative
- Daily OBV shows a well-defined downtrend, line f, and has made a series of lower lows (line g)
- Weekly OBV (not shown) is above its weighted moving average but peaked early in the year
What It Means: The overnight developments from the European summit appeared to have calmed the markets, but it’s not clear for how long. This is likely to cause a slight pullback in TLT and SHY, but it is the longer-term patterns that need to be watched closely.
An upside breakout in TLT would likely correspond to a worsening of the Eurozone crisis and a flight to the safety of the US dollar. This could also put more pressure on stocks and the junk bond market.
How to Profit: Conservative investors should wait for the chart formation to be resolved, but for the more aggressive, buy the iShares Barclays 20+ Year Treasury Bond ETF (TLT) at $118.42 or better with a stop at $115.18 (risk of approx. 2.7%).
Those currently long the iShares iBoxx High-Yield Corporate Bond ETF (HYG) should either close out the position or use stops under $85.


