Even after moving sharply higher in October, four leading Dow stocks still have room to run, making for good position trade set-ups on any pullbacks in the coming sessions.
In early October, I discussed a monthly scan that I run which ranks the 30 stocks in the Dow Industrials by their proximity to the monthly Starc- bands. (See "The Most Oversold Dow Stocks.")
Starc band analysis is one way I determine whether a stock is in a high- or low-risk buy or sell zone. When a stock is close to its monthly Starc- band (oversold), then it is a low-risk buy and a high-risk sell.
The gap between a stock's monthly closing price and the monthly Starc+ band gives a gauge of its upside potential. The above table updates the original list of the ten most oversold Dow stocks from the early-October article and how they performed throughout the month.
Of course, the performance was clearly enhanced by the exceptionally strong market in October, but it does not diminish the value of knowing where a stock is relative to its monthly Starc bands.
Caterpillar Inc. (CAT) was the most oversold stock at the end of September and then dropped below its monthly Starc- band in early October. It was the best performer for the month, up 28.5%, and the average gain for the ten stocks was just over 16%.
This monthly list of the Dow stocks, listed in order of proximity to their monthly Starc+ bands, shows that the first stock on the list, McDonald's (MCD) is still 6% below its monthly Starc+ band.
Some of these stocks still look attractive for new purchases as long as the entry point is well chosen. The monthly charts can often alert of major trend changes, as it was the long-term charts that highlighted International Business Machines' (IBM) breakout in 2009.
So which stocks have the best monthly charts now?
NEXT: Important Dow Stocks to Watch
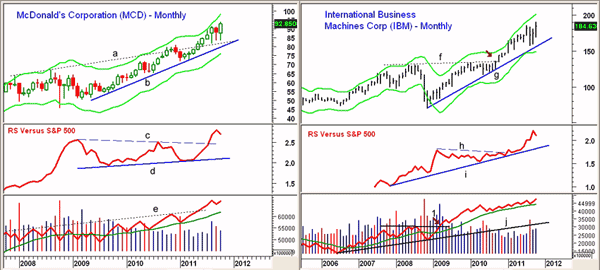
|pagebreak|Chart Analysis: McDonald's (MCD) has been a favorite since April when it completed its correction from the March lows at $72.89.
- Over the past three months, MCD has held above the monthly support at $81.80, line a. The uptrend that goes back to the 2009 lows, line b, is now at $80.40
- The monthly relative performance, or RS analysis, broke through two-plus-year resistance, line c, in July. This suggests MCD can continue to outperform the S&P 500
- The monthly on-balance volume (OBV) moved through long-term resistance (line d) in May and is acting stronger than prices
- There is first support now at $91.50 with the midpoint of the month's range at $90.60. Much stronger support stands in the $87-$88 area
International Business Machines (IBM) overcame ten-year resistance in the fall of 2010, as the 2008 highs (line f) were convincingly surpassed. IBM made new monthly closing highs in October.
- The monthly uptrend, line g, and the three-month lows are in the $157 area
- The RS line surpassed major resistance, line h, in early 2011 and is acting stronger than prices
- The RS line is in a multi-year uptrend
- The monthly OBV made new highs in October and continues to look strong
- The monthly OBV overcame major resistance in 2009 (see arrow), which was an early sign of IBM's strength
- There is initial support at $175-$178 with stronger support at $170
NEXT: 2 More Dow Stocks with Strong Monthly Charts |pagebreak|
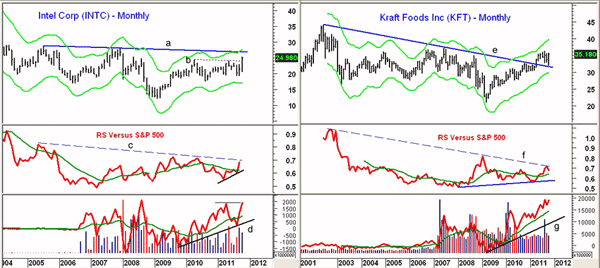
The monthly chart of Intel (INTC) reveals the very tight range over the past 18 months, line b, which was overcome in October.
- There is monthly resistance at $26.80 with the monthly Starc+ band at $27.50
- The RS line has turned up sharply and is very close to its long-term downtrend, line c. It has formed higher lows in 2011
- The monthly OBV is acting much stronger and has been in a strong uptrend, line d, since the late-2009 lows
- Monthly OBV is close to surpassing the April highs
- There is initial support (line b) at $24 with the month's midpoint range at $22.65
Kraft Foods (KFT) moved through a ten-year downtrend, line e, at the end of April 2011. The breakout level was retested in October with the low at $31.88.
- There is resistance from the 2007 highs at $37.20 with the monthly Starc+ band at $39.74
- The RS line is testing its long-term downtrend, line f, and a convincing break would be very positive
- The weekly RS analysis (not shown) broke a several-year downtrend in August
- The monthly OBV looks very strong, as it has been acting much stronger than prices since 2010. This suggests powerful accumulation
- The midpoint of the month's range is just below $32
What It Means: It is a bit surprising after the sharp gains
over the last month that more Dow stocks are not closer to their monthly Starc+
bands. These four stocks look very strong from the monthly analysis, while the
weekly/daily analysis is currently not very strong.
Stocks are down
sharply early Tuesday and the S&P futures are down close to 6% from last
week's highs to this morning's lows. Nevertheless, this still looks to be a
correction within the overall uptrend.
These four stocks should be
attractive buys on any pullbacks with first good support at the midpoint of last
month's range. These are meant to be position trades.
How to
Profit: For McDonald's (MCD), go 50% long at $90.42
and 50% long at $88.78 with a stop at $83.44 (risk of approx. 6.8).
For
International Business Machines (IBM), go 50% long at $178.72
and 50% long at $176.20 with a stop at $164.32 (risk of approx. 7.4).
For
Intel (INTC), go 50% long at $23.24 and 50% long at $22.20 with
a stop at $21.16 (risk of approx. 6.8%).


