Strong volume patterns signal that homebuilding stocks could begin an impressive year-end run. Here are entry levels and price targets for four of the industry’s major players.
Monday’s release of the US Economic and Housing Outlook hinted at some interesting trends for the housing market. The rising rental rates and pickup in new construction of apartments is starting to make single-family homes more attractive.
This release was followed on Tuesday by the National Association of Home Builders/Wells Fargo housing index, which showed that builder confidence had a nice jump. More good news came on Wednesday, when housing starts jumped 15%. The enthusiasm was dampened on Thursday, however, as existing home sales continued to decline and home prices were also lower.
The market reaction to this news has been interesting. Homebuilding stocks jumped on Tuesday with many showing very impressive volume that was two or three times the daily average. On Wednesday, housing stocks pulled back slightly despite the bullish report on housing starts, but then most edged higher on Thursday despite some early weakness.
Most analysts and fund managers do not seem interested in the homebuilders, as the fundamental investors still think there is a good chance that the economy will slip back into a recession. Some also correctly point out that one month’s data should be treated with suspicion.
The volume patterns can’t be ignored, however, and they are much more important. The daily charts show that accumulation is occurring and suggest that a short-term low is in place. That was why on Wednesday, I recommended buying the SPDR S&P Homebuilders ETF (XHB).
The individual homebuilding stocks could easily rally 10%-20% before the end of the year and now present a good/risk reward opportunity for a one- to three-month trade.
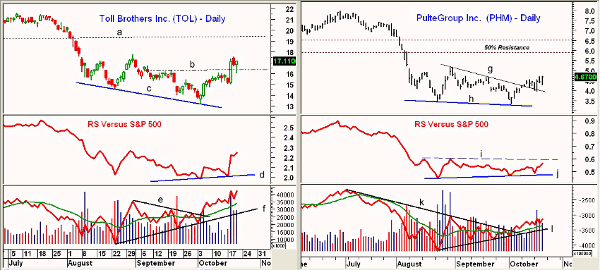
Chart Analysis: Toll Brothers (TOL) is one of the better-known homebuilders and is a $2.86 billion company. It reached its high for the year of $22.02 in February and reached a low in October of $13.73.
- The first resistance at $16.30, line b, was overcome on Tuesday
- The first upside target for TOL is in the $19.40 area, line a
- The RS line has turned up sharply but needs to move above the August high to confirm the bottom formation
- The on-balance volume (OBV) made much higher lows in October, and this bullish divergence, line f, indicates accumulation. The divergence is easy to spot by comparing line c on the price chart with line f on the OBV
- The break through the OBV downtrend, line e, occurred one day after the October lows
- There is initial support at $16.20-$16.60 with stronger support in the $15.50 area
PulteGroup Inc. (PHM) is a $1.8 billion homebuilding company that has a 52-week high of $8.69. The October low at $3.29 was just slightly below the August low of $3.40, line h.
- The move through the short-term downtrend, line g, was positive, and the breakout level was retested this week
- Next resistance is at $5.16 with the 50% retracement resistance at $5.90
- The RS did not confirm the recent lows, line j, but needs to move through the resistance at line i to signal that PHM will outperform the S&P 500
- The strong uptrend in the OBV, line l, is positive, as was the break of its downtrend, line k
- The bullish divergence in the OBV indicates that volume was heavier on the up days when stock was being accumulated
- Initial support now stands at $4.50 with further support in the $4.00 area
NEXT: More Bullish Signs from Top Homebuilders
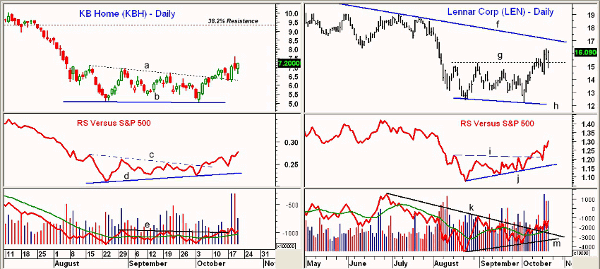
|pagebreak|KB Home (KBH) is a $550 million homebuilder that currently yields 3.6%. The stock hit a high in January 2011 of $16.11.
- The daily chart shows that last week, prices broke through resistance, line a, in the $6.50 area
- The 38.2% Fibonacci retracement resistance is at $9.30, which is a reasonable upside target
- This support was retested this week before prices surged on Tuesday
- The relative performance, or RS analysis, completed its bottom formation (lines c and d) in early October when resistance was overcome. This signal led prices by a few days
- The volume was much heavier at the August lows than it was in October, and the OBV has moved through resistance
- Initial support now stands at $6.80-$7.00 with stronger support in the $6.00-$6.20 area
Lennar Corp (LEN) is a $3 billion homebuilder that traded as high as $21.54 last March and hit a low of $12.14 on October 4. This was below the August 23 low of $12.34, line h.
- The resistance at $15.30 (line g) was surpassed last week, and after a setback, LEN confirmed the upside breakout on Tuesday
- The daily downtrend, line f, is in the $17.00 area with stronger resistance at $18.50
- The RS line formed higher lows in early October, line j, which is positive. The move through resistance at line i confirmed the bottom formation
- The OBV formed a bullish divergence at the recent lows (line m) and then moved through its downtrend, line k
- There is short-term support now at $15.30-$15.50 (line g) with stronger support at $14.50
What It Means: The very positive daily volume patterns in the homebuilders indicate that this industry group is likely to surprise over the next few months. There are no conclusive signs yet of a major bottom, but the short-term action does favor new long positions.
It will be important to manage these positions if the buying levels are hit, however. Selling half the position at the first price targets and then raising the stop on the remaining position to the entry price will protect your portfolio.
How to Profit: For Toll Brothers (TOL), go long at $16.46 with a stop at $14.96 (risk of approx. 9.1%). Sell half the position at $18.84 and raise the stop on the remaining position to $16.46.
For PulteGroup Inc. (PHM), go long at $4.48 with a stop at $3.89 (risk of approx. 13.1%). Sell half the position at $5.64 and raise the stop on the remaining position to $4.48.
For KB Home (KBH), go long at $7.04 with a stop at $6.12 (risk of approx. 13%). Sell half the position at $8.34 and raise the stop on the remaining position to $7.04.
For Lennar Corp. (LEN), go long at $15.52 with a stop at $14.22 (risk of approx. 8.3 %). Sell half the position at $17.54 and raise the stop on the remaining position to $15.52.


