Despite rampant bearishness, the Advance/Decline (A/D) lines for major stock indices suggest the formation of a market bottom. Look to buy dips into support in advance of a rally into year end.
The stock market rally from the October 4 lows has been impressive, and those on the short side were likely squeezed a bit more on Wednesday when the Spyder Trust (SPY) and E-mini S&P 500 futures slightly exceeded the September 20 highs.
For most, the recent rally has not changed their negative outlook for either stocks or the economy. The recent strength is viewed by many as a bear market rally and bearish sentiment is still very high. Over the past few weeks, I have commented that the prevailing negative view of both the stock market and the economy was more consistent with a stock market bottom, not the start of a major new decline.
Even those who are not so bearish see the recent strength as simply part of the trading range and do not expect stocks to move significantly higher. The market internals are painting a different picture, as most of the Advance/Decline (A/D) lines on the major averages formed bullish divergences last week and have already broken out of their trading ranges. Fewer stocks made new lows last week than in August, which is also a positive sign.
The weak close in the futures markets and the overbought readings of short-term A/D indicators makes a pullback very likely. Stocks are lower in early-Thursday trading amid fresh concerns that China’s economy is faltering. Any negative news from the Eurozone is likely to spur heavier selling, which is then likely to give the bears some hope.
In my view, the expected correction, or dip, should provide a buying opportunity in some of the favored sectors like retail apparel and technology.
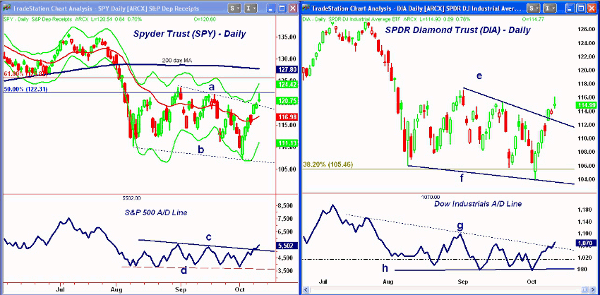
Chart Analysis: The Spyder Trust (SPY) is up 12.4% from last Tuesday’s lows as the downtrend, line a, has been overcome. SPY came very close to the 50% retracement resistance level at $122.31 on Wednesday.
- The 61.8% Fibonacci retracement resistance level is at $125.85 with the declining 200-day moving average (MA) at $127.80
- The A/D line has broken out of its trading range, moving through resistance at line c
- The key support level for the A/D line is now at line d
- There is initial support now at $119-$119.50 with much stronger support in the $116-$117 area. This also corresponds to the rising 20-day exponential moving average (EMA)
The SPDR Diamonds Trust (DIA), which tracks the Dow, has also been able to overcome its downtrend, line e, as well as its prior swing high at $115.26. There is further resistance at $117.03 with the key 61.8% retracement resistance at $119.16.
- The Dow Industrials’ A/D line has moved through its two-month downtrend, line g, after forming a bullish divergence at the recent lows, line h
- The fact that the A/D line did not make new lows last week indicates that fewer sellers were pushing stocks lower
- There is first support for DIA at $113.50-$112.50 with more important support in the $110-$109 area
- The daily on-balance volume (OBV) (not shown) is positive and formed a bullish divergence at the recent lows
NEXT: Favorable Buy Point in Another Stock Index ETF |pagebreak|
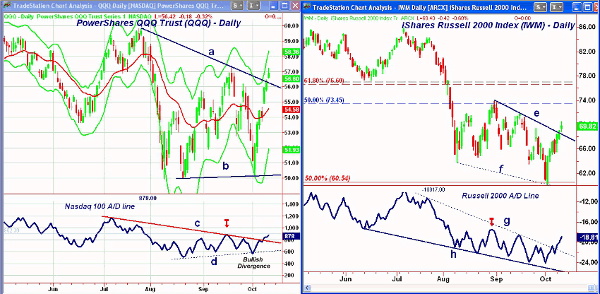
The rally in the PowerShares QQQ Trust (QQQ), which tracks the Nasdaq 100 index, has been the most impressive, up over 13% from last week’s lows. There is further resistance at $58 with the daily Starc+ band at $58.36.
- The 2011 high is at $59.83 with the weekly Starc+ band now at $60.54
- The Nasdaq 100 A/D line has broken its downtrend, line c, but has not yet surpassed the September highs
- The A/D line did form a positive divergence at the recent lows, line d
- The daily OBV (not shown) is positive, as volume was much lower last week than at the August lows
- There is initial support at $55-$55.50 and stronger support at $54-$54.60 and the 20-day EMA
Even the lagging iShares Russell 2000 Index Fund (IWM) has overcome its first resistance (line e) but is still well below the mid-September high at $72.03. IWM made a high in late August at $73.89.
- The Russell 2000 A/D line has broken its well-established downtrend, line g, which goes back to the July highs. It did not form a positive divergence at the recent lows
- A move in the A/D line above the late-August high (see arrow) will be much more positive
- The relative performance, or RS analysis (not shown), indicates that both the mid and small caps are still lagging the S&P 500
- There is first support for IWM at $67-$67.40 with much stronger support in the $65-$66 area
What It Means: The patterns in the A/D lines, including the NYSE A/D line, are consistent with the formation of a significant stock market bottom. This should set the stage for a strong rally into year end, but prices will need to move much higher to get the public interested in stocks again.
The A/D ratios on a correction or dip will be important, as the A/D lines need to develop a pattern of higher lows and higher highs to signal upward acceleration. Remember that buying the dip refers to purchases that are done at previously defined chart support or Fibonacci price levels. Of course, stops need to be placed at the same time as the buy orders so that trading risk is clearly identified.
How to Profit: Of the four index ETFs, the PowerShares QQQ Trust (QQQ) looks the most attractive. Go 50% long QQQ at $54.93 and 50% long at $54.06 with a stop at $49.74 (risk of approx. 8.6%). On a move above $58.60, raise the stop to $53.66.
For the Spyder Trust (SPY), go 50% long at $117.54 and 50% long at $115.10 with a stop at $112.12 (risk of approx. 3.6%). On a move above $124.70, raise the stop to $115.40.
For the SPDR Diamonds Trust (DIA), go 50% long at $112.34 and 50% long at $110.16 with a stop at $106.74 (risk of approx. 4.1%). On a move above $117.10, raise the stop to $109.54.
There is no recommendation for the iShares Russell 2000 Index Fund (IWM) at this time.


