A move in oil or stocks can often telegraph a move in the other market a few days early, which can be an invaluable headstart. You can often profit on these signals with ETFs in either market.
Many stock investors or traders do not watch the crude oil market as closely as they should. For many years, I’ve compared the chart patterns of the crude oil futures with those of the S&P 500 or the Spyder Trust (SPY).
I have found many instances where crude oil tops or bottoms ahead of the S&P 500. Often, the two markets will show similar chart formations, but one of them will be completed ahead of the other.
Currently, the action in crude oil, as well as the United States Oil Fund (USO), suggests that the short-term rallies are ending. This may create an opportunity in the ProShares UltraShort Oil & Gas ETF (DUG) and also suggests that the stock market is once again ready to turn lower.
This is consistent with the short-term action of the McClellan Oscillator, one of my favorite A/D indicators. The oscillator peaked at +263—an overbought level—on Wednesday, and has now turned lower.
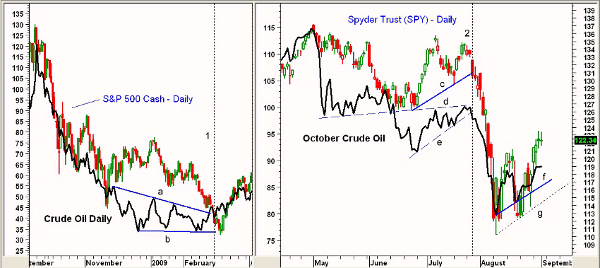
Chart Analysis: The first chart compares crude oil and the S&P 500 in late 2008 and early 2009.
- The crude oil futures formed a double bottom in February, line b, that was confirmed by the move in crude oil through resistance, line a
- The cash S&P 500 shows a much different pattern, as it made lower lows in early March
- The breakout in crude oil on February 26 (line 1) came seven days before the S&P 500 bottomed on March 6
This current chart compares the October crude oil futures with the Spyder Trust (SPY). In early July, the SPY moved above the late May high, while October crude oil was much weaker and had just rebounded to resistance at line d.
- October crude oil formed a bear flag formation, lines d and e, in July, which was a much weaker pattern than SPY
- Both broke support at the same time, line 2, as they declined into the August lows
- The recent rebound in October crude oil, line f, has been considerably weaker than the rebound in the SPY
- SPY has formed significantly higher highs, while crude oil has not
- Crude oil is also much closer to support at $85.30 (line f), which is about $3.50 above Thursday’s close
- A break of this support could precede a drop through SPY support at $114.70, line g
NEXT: How to Invest
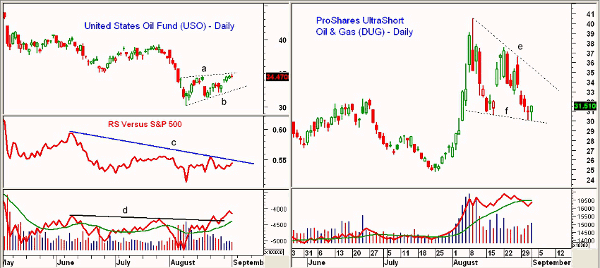
|pagebreak|The United States Oil Fund (USO) hit a low of $30.31 on August 9 and hit a high on Thursday at $34.89. The daily chart shows a flag formation, lines a and b, which is typically a continuation pattern.
- A break below support at $32.20 to $32.40 would signal a resumption of the decline, with initial downside targets in the $28.50 to $29.50 area
- The relative performance or RS analysis is still in a downtrend, line c, as it has formed lower lows
- The on-balance volume (OBV) is positive, as it was able to overcome resistance at line d. The weekly OBV (not shown) is negative, below its declining WMA
- Once above $35, there is further resistance in the $37.50 area
The Proshares UltraShort Oil & Gas ETF (DUG) is a double-inverse ETF based on the Dow Jones US Oil & Gas Index. DUG hit a high of $40.49 when crude oil was making its low.
- The daily chart shows a triangle formation (bull flag), lines e and f
- There is initial resistance at $32.50 to $33, with the downtrend at $35.40. A close above $36.55 will confirm an upside breakout
- The initial target is the August highs, with the 127.2% target to follow at $43.50
- The daily OBV did confirm the August highs, and has turned up. The weekly OBV (not shown) is positive, as it is well above its rising WMA
- Initial support is now at Thursday’s low of $30.09, with further levels at $29
What it Means: Looking for similarities and differences between crude oil futures and a broad-based US stock index or ETF can often give advance warning of a change in the trend.
The current analysis suggests that crude oil and the Spyder Trust (SPY) will drop further, with crude oil completing its flag formation ahead of SPY. This would imply that the SPY could also break its support a few days after crude oil.
In this scenario, an inverse ETF like Proshares UltraShort Oil & Gas ETF (DUG) could resume its uptrend.
How to Profit: The monthly jobs report was just released and was much weaker than expected, and in early reaction the S&P futures are down more than 18 points.
For Proshares UltraShort Oil & Gas ETF (DUG), buy at $31.27 with a stop at $29.77 (risk of approx. 4.8%). If DUG instead gaps higher, high risk traders could buy at 40 cents under the opening with a stop still at $29.77. On a move above $35.10, raise the stop to $31.44.


