Tech giants Apple (AAPL) and Amazon.com (AMZN) have held up well despite heavy market volatility, and still-favorable chart patterns make each stock a good buy on an upcoming pullback.
It has been a wild week in the markets, and the ranges in the stock index futures have been incredible. More fireworks are possible on Friday, and while overseas markets are showing nice gains a few hours before the NYSE opening, that does not tell us much about the close.
With two sharp up days and two sharp down days so far, Friday’s close will break the tie. All of the major averages and their respective ETFs closed Thursday well off the week’s worst levels. The Nasdaq 100, as represented by the Powershares QQQ Trust (QQQ), has acted the strongest, and the strength in Cisco Systems (CSCO) helped the market early Thursday.
Since the close on July 22, QQQ is down 8.2% versus a 12.8% drop by the financial-heavy Spyder Trust (SPY), which tracks the S&P 500. The SPDR Diamonds Trust (DIA), which follows the Dow Industrials, is down 12.2% during this time.
Two of the best-known tech bellwethers, Apple, Inc. (AAPL) and Amazon.com (AMZN), have held up even better, but is this important?
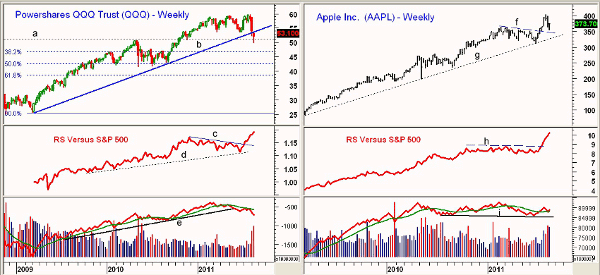
Chart Analysis: The weekly chart of the Powershares QQQ Trust (QQQ) shows that the uptrend from the 2009 lows, line b, was broken this week, but a close below that level would be more negative. With Thursday’s close, it is down just 1.3% for the week.
- The support from the 2010 highs (line a) has been tested with the major 38.2% Fibonacci retracement support at $46.85
- The minor 50% support at $50.55 (calculated from the July 2010 lows) was exceeded this week. A close below this level would be more negative
- The relative performance, or RS analysis, signaled that the tech sector was going to outperform in early July when it broke through resistance at line c. The long-term uptrend (line d) is still intact
- The weekly on-balance volume (OBV) looks less positive, as it violated its uptrend, line e, in May and is below its weighted moving average (WMA). It shows a pattern of lower highs and lower lows. The daily OBV is also negative
- There is next retracement resistance at $54.90-$56
Apple Inc. (AAPL) is down 7.6% from its all-time highs at $404.50, and on the weekly chart, the recent drop looks like just a retest of the July breakout (line f).
- There is next support at $347 with the major 38.2% support for at $340. The long-term uptrend, line g, is at $324 with the major 50% support at $320. (See latest Fibonacci analysis for AAPL here.)
- The RS line staged a major breakout in July, overcoming resistance at line h
- The weekly OBV is trying to turn up from its weighted moving average, but it did not confirm the recent highs. There is key OBV support at line 1
- The daily OBV is negative, but did confirm the recent highs
- AAPL is nearly flat for the week with next resistance at $383.50-$385
NEXT: Latest Chart Analysis for Amazon.com (AMZN) and Google (GOOG)
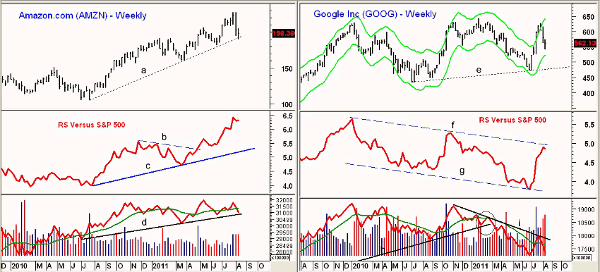
|pagebreak|Amazon.com (AMZN) has tested its weekly uptrend, line a, and has so far held well above the last swing low at $181.59. A close below this level would create a pattern of lower lows, which could be the start of a new downtrend.
- AMZN is currently 12.7% below the recent highs at $227.45
- The weekly RS analysis still looks strong, as it broke out to the upside in April, overcoming resistance at line b. It is now well above the long-term support at line c
- The weekly OBV has formed lower highs and did not confirm the recent highs. A break of the uptrend, line d, and the March lows would be more negative
- A close above the short-term resistance at $205.10 should signal a rally to the 50% retracement resistance at $209.20
Google, Inc. (GOOG) closed above the weekly Starc+ band four weeks ago and is now down 10.4% from the highs. The weekly Starc- band is now at $517 with weekly trend line support, line e, at $477.
- The RS analysis has formed lower highs (line f) and lower lows (line g) since late 2009. It has recently rallied sharply, but the pattern is still not consistent with that of a market-leading stock
- The OBV also looks weak, as it violated its uptrend, line h (see circle), early in the year. It now shows a well-established downtrend, line I, which is also negative
- The daily OBV (not shown) turned positive near the recent lows and is still acting well
- There is first resistance now at $590-$600 and a close back above $600 would be a short-term positive
What It Means: The powerful nature of the recent market decline should eventually set the stage for a more sustainable rebound. Most are expecting such a rally to fail in the 1200-1220 area in the S&P, as the 50% retracement resistance is at 1229. Typically, when there is such a consensus view, it will either result in a much weaker or much stronger rally.
The positive technical patterns for Apple, Inc. (AAPL) and Amazon.com (AMZN) make both look attractive for a contra-trend rally, as well as for those who do not believe the bull market is over. Google, Inc. (GOOG) looks much weaker from an intermediate-term standpoint despite the positive short-term action.
How to Profit: The incredibly wide trading ranges in the major averages, as well as these tech favorites, makes the risk on new positions quite high. If the rally stalls either Friday or early next week, I would look for a pullback in AAPL and AMZN to their recent lows to take light long positions. Though the major averages could violate this week’s lows on a further drop, these two stocks should not.
See also: New Catalyst Can Send Apple to $500


