Big yields sometimes hide excessive risk, as evidenced by these two recent examples, which show the importance of watching for certain warning signals on the charts before jumping into select high-yield instruments.
One of the first lessons income investors normally learn is that when one instrument has a much higher yield than others, it is a signal that the risk is also much higher. This year has been a tough one for those looking for yields, while the bond issuers have been in paradise. In May, MIT offered those AAA 100-year bonds with a yield of 5.6%, which were quickly snapped up. This is still hard for me to imagine.
Many have been mesmerized by some of the high-yielding REITs that invest in mortgage-backed securities where the yields have been double or triple that of the 30-year Treasury bond. Buyers of these REITs are trading a higher yield for increased risk, and many were taught a painful lesson last week.
While the debt debacle only hit most investors this week, some of these REIT investors were hit hard the week before. The fear that interest rates would spike, along with a sharp increase in the financing cost of their short-term debt caused a run for the exits, and many of these high-yield bets were hit hard.
Stop-loss selling certainly contributed to the severity of the declines, and in just a few minutes of trading last Friday, some high-yield investments dropped 18%-22% below the previous day’s close. By the end of the day, they had rebounded to close just a bit lower.
I would maintain that these stops were poorly placed and would remind anyone investing in high-yield (high-risk) instruments that they cannot buy and forget. Those who paid close attention to the charts of these two particular high-risk investments could have avoided getting hurt in this mini “flash crash.”
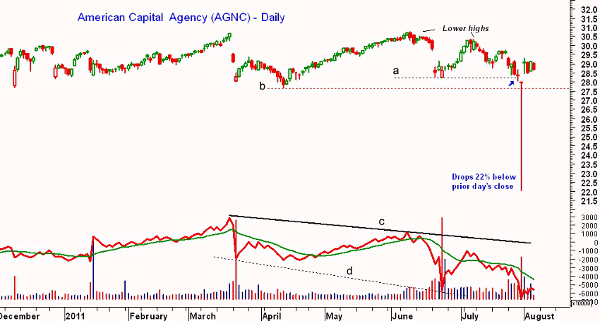
Chart Analysis: American Capital Agency Corp. (AGNC) is a real estate investment trust (REIT) which invests in agency pass-through securities and collateralized mortgage obligations that are funded primarily through short-term borrowings. The $5 billion REIT currently pays a dividend of $5.60, which at Wednesday’s closing price of $29.11 works out to a yield of $19.2%.
- The daily chart shows the broad trading range with the April lows at $27.70 and the June highs at $30.76. The flat 200-day moving average (MA) is at $29.20. Friday’s drop took AGNC 22% below the 200-day MA. The gaps on the chart reflect distributions
- Those who bought in 2011 should have initially used a stop under the December 9, 2010 low of $27.70, which would also have held in April
- AGNC made a higher high in early June at $30.74, but then made a lower high in July at $30.34. These lower highs were a warning that a downtrend could be developing. This made the June lows at $28.63, line a, the key level to watch
- A break of this low would confirm a downtrend, as it would create a pattern of lower highs and lower lows. Last Thursday’s low was $28.38, well below the key level of $28.63. With a low-beta stock like AGNC, I usually recommend a stop that is 0.5% under the low, which would have been at $28.49.
- The following day, AGNC opened at $28 before dropping to a low of $22.03
- The daily on-balance volume (OBV) had been diverging since March, line c, suggesting that fewer buyers were pushing prices higher. Volume was heavy in June after the distribution, and the OBV formed lower lows (line d). The weekly OBV (not shown) is also negative
- There is resistance for AGNC now at $17.89 and the flat 200-day MA
NEXT: Another High-Yield Bet Gone Bad
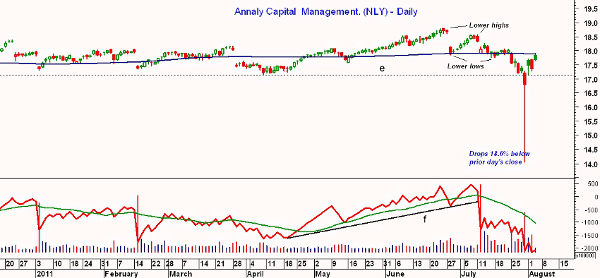
|pagebreak|Chart Analysis: Annaly Capital Management Inc. (NLY) is a $14 billion diversified REIT that engages in the ownership, management, and financing of a portfolio of investment securities. It pays a dividend of $2.60, and with Wednesday’s close at $17.35, that translates to a yield of 15%.
- NLY closed last Thursday (July 28) at $17.21, then opened unchanged on Friday before declining to a low of $14.05. It closed the day at $16.78
- The daily chart of NLY was giving even stronger warnings than that of AGNC before the plunge. The stock dropped on June 28 after the distribution, testing the 200-day MA
- NLY then made a lower high and gapped lower on July 12 amid heavy volume
- On July 15, it violated the late-June lows at $17.86. This created a pattern of lower highs and lower lows that was further confirmed by the drop six days later on July 25, when NLY closed at $17.54
- Given this technical action, anyone would have had to be asleep if they kept their stop under the April lows, line e, at $17.12, but apparently many were
- The daily OBV broke its uptrend and weighted moving average (WMA) on July 12 and started to act much weaker than prices
- There is resistance for NLY now at $17.89 and the flat 200-day MA
What It Means: Most traders know that the higher-risk instruments need to be monitored more closely. Not all income investors are accustomed to looking at things this way, but I feel this is an important lesson to learn. Though REITs are generally not viewed like futures, REITs with unusually high yields like these two must to be closely watched. Technical analysis can often be the best tool for spotting an increase in selling pressure.
How to Profit: Clearly, if you are still in either of these two REITs, I would either close out on a bounce to the 200-day MAs or at least lighten up your positions now. A drop below Monday’s low would increase the odds of further selling.


