The markets seem likely to re-test recent lows, and if key technical levels are broken, it could easily spark a selling explosion. Consider some selective selling, and watch these price levels on the major stock index ETFs.
Wednesday’s sharp decline has done some serious damage to the short-term technical outlook. The market internals were very negative and the Advance/Decline (A/D) lines for all the major averages have broken their uptrends. Several have also violated their recent lows.
After a week of complacency, it seems like more market participants are now coming to the realization that the politicians in Washington are stupid enough to play with the debt ceiling. I am sure some of them as kids insisted on lighting firecrackers with too-short fuses, too. Their actions now could have the same impact on the stock market. Of course, they will face no consequences for these actions, as most likely have bright futures as corporate lobbyists.
From a technical standpoint, many of the major averages like the S&P 500, as tracked by the Spyder Trust (SPY), look ready to test the recent lows from the middle of July. If this support is violated, the market is vulnerable to an explosion of selling that could take us to the important support from the March lows, which is about 4% below current levels.
The new highs in the weekly A/D line in April indicate that the bull market will still be alive even if the March lows are tested. Of the major sectors, there are only a few, including energy, utilities, consumer discretionary, and technology, that have not dropped below the July lows.
On a short-term basis, the market is getting quite oversold, as the McClellan Oscillator has dropped below the June/July lows. It is now at -225, which is not far above the March lows at -268. However, a weak rally, especially on a resolution of the debt-ceiling debate, is likely to set the stage for a further decline.
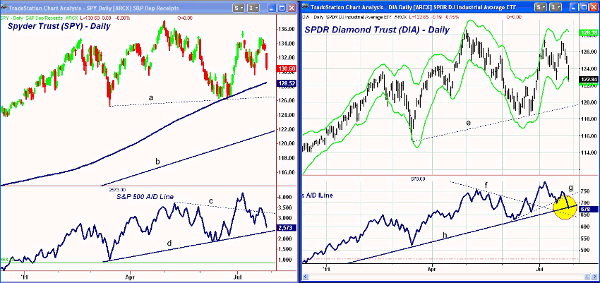
Chart Analysis: The Spyder Trust (SPY) is not far above the July 18 lows at $129.63 with the still-rising 200-day moving average (MA) at $128.52.
- If the 200-day MA is broken, the critical levels are the April lows at $126.19 and the March lows at $125.28. The longer-term uptrend, line b, is in the $122 area
- The S&P 500 A/D line has dropped below the July lows, which has reversed the positive break of the downtrend, line c. The A/D line has next good support at the uptrend, line d
- There is initial resistance for SPY at $131.70 to $132 with stronger resistance at $132.80-$133
The SPDR Diamonds Trust (DIA), which tracks the Dow Jones Industrial Average, closed on the daily Starc- band and is very close to the June lows at $122.72. There is some additional support at $122.61.
- Further chart support in the $121.50-$122 area with the uptrend from the March and June lows, line e, now at $119.50
- The lows in June were at $118.64 with the March lows at $115.51
- As noted last week, the A/D line was lagging the price action, as its last high was well below the early-July peak
- The A/D line has now broken short-term support (line g) and is also slightly below more important support at line h. The next good support corresponds to the June lows
- There is initial resistance at $124.50-$125 with stronger resistance above $126
NEXT: Critical Price Levels to Watch for the Major Index ETFs
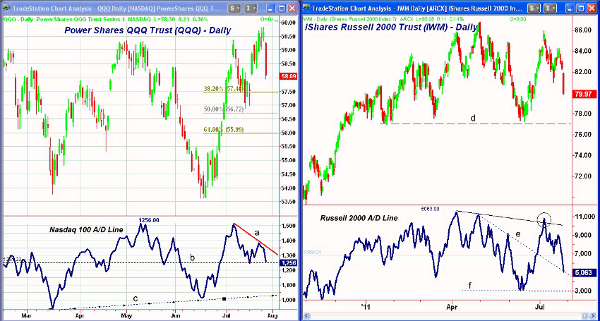
|pagebreak|The daily chart of the PowerShares QQQ Trust (QQQ), which tracks the Nasdaq 100 Index, was still in a clear uptrend before yesterdays plunge. The next band of support is in the $56.87-$57.80 area with the 50% retracement support at $56.72.
- Technology is still the market’s strongest sector, and QQQ is well above the June lows at $53.62
- A divergence was forming in the Nasdaq 100’s A/D line (line a), as it failed to confirm the new price highs last week
- The divergence will be confirmed by a violation of support at line b. There is longer-term support for the A/D line at line c
- There is first resistance now at $58.80-$59
The small-cap stocks, as represented by the iShares Russell 2000 Index Fund (IWM), are still looking the weakest and have been since the A/D line failed to confirm the new highs in April. There is key support (line d) in the $77.23-$77.57 area, which encompasses both the March and June lows.
- A break of these levels will suggest a drop to the 2010 highs at $74.66
- The Russell 2000 A/D line slightly exceeded its downtrend in July (see circle) but has dropped very sharply in the past few days
- A break in the A/D line below support at line f is likely to precede a drop below the March-to-June lows
- There is initial resistance for IWM at $81.30-$81.60 and then much stronger resistance at $82.70-$83
What It Means: The deterioration in the technical picture increases the chances that the June lows will be tested. Clearly, stocks need to stage an impressive rebound to reverse this damage. This would mean that advancing issues should outnumber declining by at least four-to-one with QQQ closing back above $59.
Watch how the market reacts if these levels are reached on the four ETFs:
- Spyder Trust (SPY): $129.63
- SPDR Diamonds Trust (DIA): $122.61
- PowerShares QQQ Trust (QQQ): $56.87
- iShares Russell 2000 Index Fund (IWM): $77.23
How to Profit: There are still quite a few stocks that look strong on a technical basis, but there are fewer sectors that are doing well. A bounce is likely over the next few days, and for anyone who feels uncomfortable with the allocation of stocks in their portfolio, prudence would suggest doing some selective selling.
Investors long any stocks that have not yet reported earnings should definitely consider lightening those positions, as the market has not been kind to earnings disappointments.


