Yesterday’s circus in the oil market will probably lead to further declines in both crude oil and stocks, as several oil majors have violated key supports.
Crude oil’s failure to rally through first resistance, and the ensuing sharp downside reversal, has seriously weakened the outlook for the energy sector.
The Energy Select Spyder (XLE) was clearly the star performer in the first quarter of 2011, but failed to make new highs with many of the market averages in early May.
In last night’s report, Fasten Your Seatbelts, I noted that the major stock-market averages were very near critical short-term support and that they were moving in lock-step with crude oil. Later, I examined several major oil companies, all among the largest components of XLE, and they also appear to be completing significant top formations.
The completion of these tops in the energy sector will impact the S&P 500 and Dow much more than the energy-light Nasdaq-100. If we get a drop in the major averages to more important support, it will be important for another sector to step in and take over leadership. It could be the tech sector.
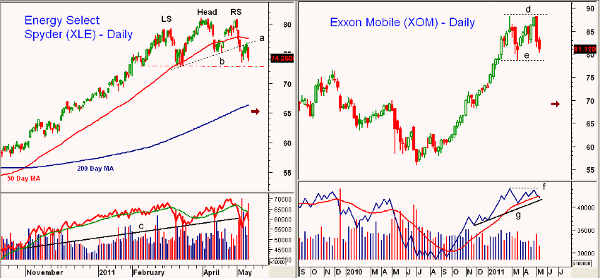
Chart Analysis: The daily chart of the Energy Select Spyder (XLE) shows a completed head-and-shoulders (H&S) top formation, as the neckline support (line a) was violated last week.
- This week’s rally just tested the neckline before Wednesday’s sharply lower close. There is now key support at $72.90, which may be broken Thursday
- The minimum downside targets from the top formation are in the $70 area
- There are more aggressive downside targets in the $65 to $66.40 area, which also corresponds to the 50% retracement support and the rising 200-day MA
- The daily OBV violated its uptrend last week (line c), and has now turned lower from its declining WMA. I noted recently that the weekly OBV was starting to act weaker than prices
- First key resistance now stands at $76.80 to $77.50, with major feedback in the $79 to $80 area
Exxon Mobil (XOM) may be forming a weekly double-top formation, as the recent rally failed to surpass the February highs at $88.23 (line d).
- There is key support now at $78.80, and a break below this level would complete the double-top formation
- The 38.2% support is at $76, with the 50% retracement support at $72. The double top has downside targets in the $69 area
- The weekly OBV failed to confirm the recent new weekly closing high (line f) and looks ready to drop below its WMA this week. A break of support at line g will confirm that a top is in place
- The volume picked up on Wednesday’s drop, and the daily OBV (not shown) has dropped below its WMA
- Initial resistance is now between $84 and $84.50, with much stronger levels above $86
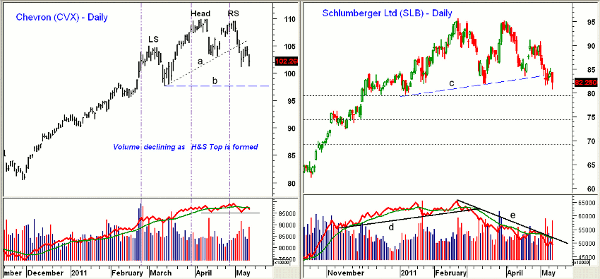
Chevron Corp. (CVX) also appears to have completed an H&S top formation, as the neckline (line a) was broken last week.
- The next key support is at $97.70 (line b), with targets from the H&S top formation in the $95 to $96.40 area, which coincides with the 50% retracement support
- The volume pattern is consistent with an H&S top. As highlighted by the vertical dashed lines, volume was strongest on the left shoulder (LS), lower when the head was formed, and even lower as the right shoulder (RS) was formed. Volume increased as the neckline was broken
- The daily OBV has dropped below its WMA, and a violation of the recent lows will complete a top
- Initial resistance at the neckline stands in the $106 area, and a move this level would be positive. Strong resistance lies beyond, in the $108 to $110 area
Schlumberger Ltd. (SLB) is acting the weakest of the three large oil companies, as it broke below $83.50 last week, and did not bounce much this week.
- On Wednesday, both the March and April lows were violated. The 38.2% support is next at $79.50, and the 50% retracement level stands at $74.40
- The top formation has targets in the $71 to $72 area
- The daily OBV broke through support (line d) in early March. It is now in a well-defined downtrend (line e). Volume increased sharply on the break of support
- The weekly OBV (not shown) is below its declining WMA
- First resistance is at $85, with much stronger levels in the $87 to $89 area
What it Means: The recent weak action in many of the largest oil companies suggests that they will continue to move lower. This will be a drag on the large-cap indices, though lower oil prices should benefit the transportation stocks.
The 200-day MA on XLE is still rising strongly, and this suggests the long-term trend is still positive. Therefore, a decline in these oil companies and the XLE to their downside targets may present a buying opportunity later in the year.
How to Profit: The action the rest of the week will be important—while the overall market may hold its support levels from last week, these oil companies do seem headed lower as we head into the summer.
If you are long these large oil companies, a decline to the projected targets from the top formations would be a major hit, unless you are long these stocks from much lower levels.
I would not simply hold them for their attractive yields, as a 5% to 15% decline in any stock will erase the benefits of a high yield. Be sure you have your stops in place, and if we get a bounce I would use it to lighten or close out long positions. Keep an eye on the $72.90 level on the XLE.
For those familiar with the covered call strategy should consider selling deep in the money calls against your long stock positions.


