Materials are likely to underperform sector leaders like Health Care and Consumer Staples this summer. Here’s the latest chart action for the materials sector ETF and three of its key holdings.
The stock market was not able to hold its early gains into the close on Monday as most of the major averages settled on their lows. For the broad market, this may signal the start of a short-term pullback that is needed to cool the overheated bullish sentiment. The fact that the NYSE McClellan Oscillator has turned down from +150 is consistent with a correction.
The bullishness is reflected in a newly released survey of Charles Schwab’s active traders, which revealed that technology was the favorite sector for 36% or respondents, followed by 26% for materials, and just 13% for financial stocks. From a contrary standpoint, these numbers do not offer much insight, but the lack of interest in energy (4%) was interesting.
I have been watching the action in the Select Sector SPDR - Materials (XLB) since the April highs, and the weak recent rally, combined with Monday’s poor close, has weakened the short-term outlook. By reviewing the largest holdings in XLB, there are three stocks that look vulnerable to a 5%-10% correction.
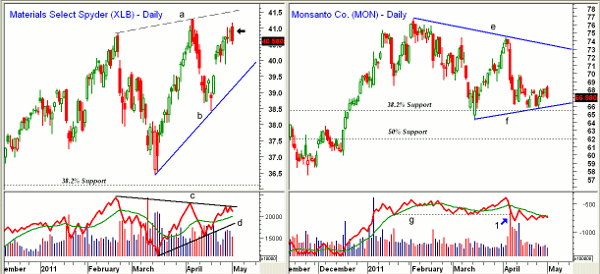
Chart Analysis: The Select Sector SPDR - Materials (XLB) formed higher highs in February and April (line a), but Monday’s weak close (see arrow) suggests the current rally has stalled.
- The initial support lies at the gap in the $39.54-$39.89 area with the uptrend (line b) a bit lower at $39.31
- A violation of the swing low at $38.44 would signal a drop back to the March lows at $36.44, if not the 38.2% support at $36.10
- The pattern in the on-balance volume (OBV) looks toppy considering that while XLB was making higher highs, the OBV was forming lower highs (line d). A break of its weighted moving average (WMA) and the uptrend, line e, would generate a short-term sell signal
- XLB would need to close above $41.16 to turn the short-term momentum positive
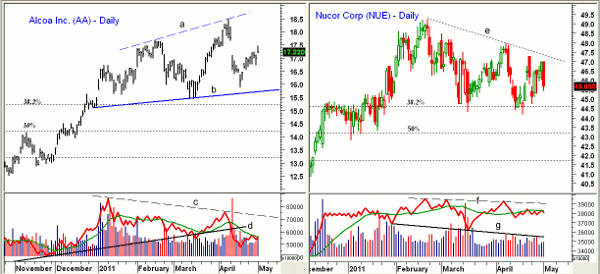
The daily chart of Monsanto (MON) shows that the stock peaked at $76.69 on February 1 and then formed a lower high in February at $74.46. Though the daily downtrend is not that negative, it is important to know that MON just tested the weekly downtrend in February that goes back to 2009 and 2010.
- Since reversing in early April following disappointing earnings, the stock has been in a narrow range, trying to hold the 38.2% support at $65.50
- The March 15 low was $64.29 and there is additional chart support from last fall at $63.50-$64 with the 50% retracement support at $62
- The heavy selling in early April (point 1) dropped the OBV below support at line g. It has just rallied back to its declining weighted moving average, which is a short-term negative. The weekly volume (not shown) is still above its WMA
- There is first resistance now at $68.50-$69.50 with additional resistance at $71. The downtrend (line e) is at $73.50
NEXT: Latest for Alcoa and Steel Giant NuCor; Key Price Levels to Watch |pagebreak|
Though on the surface, Alcoa Inc. (AA) was one of Monday’s few positives, as it closed up over 1%. Looking closer, however, it settled on the lows, which is not a good sign. AA has just partially filled the gap from April 12, when it opened lower after reporting earnings.
- There is now short-term support at $16.44-$16.50 and then at $15.72-$15.88, which corresponds to the April lows and trend line support (line b)
- The 38.2% retracement support is at $15.20 with the 50% support level at $14.20
- The daily OBV peaked in early 2011 and has since formed lower lows (line c) while AA was moving higher, line a. This divergence indicates that fewer buyers have been pushing AA higher
- The daily OBV has violated its uptrend, line d, which goes back to last summer’s lows. It is now trying to move above its WMA, but needs to break above the downtrend (line c) to turn positive
- The weekly OBV (not shown) is still holding above support
- A daily close above $17.80 would be positive.
Steel stocks have also been under pressure, as NuCor Corp (NUE) had a wide range on Monday and closed on the lows. The daily downtrend from the February highs at $49.24 is now at $47.34.
- The daily OBV is testing its flat weighted moving average and shows a broad trading range for most of the year (lines f and g). The OBV dropped sharply in March, but then rebounded in April, testing its highs (line f)
- A drop in the OBV below the April lows should precede heavier selling
- So far, NUE has held the 38.2% support at $44.60 on a closing basis, with further support at $44.20-$44.34, which encompasses the April and March lows
- If these levels are broken, the 50% support stands at $43.20 with the 61.8% support at $41.75
- A daily close above the April high at $48 would be a short-term positive
I have focused on the large holdings in XLB that have the weakest charts. These stocks have not yet generated weekly sell signals, but if they break below the recent lows, they should decline to their 50% support levels.
Two of the largest holdings in XLB, Dow Chemical (DOW) and Praxair Inc. (PX) still look positive and continue act better that the sector.
How to Profit: Though I have no specific profit strategy in mind, here are some levels to watch:
For XLB, a decline back to the $38.50 level looks likely, and I can’t rule out a test of the $36.10-$36.50 area. A close back above $41.16 will turn the outlook positive.
Monsanto (MON) looks the weakest of the three stocks and is likely to drop to the 50% support at $62, if not the 61.8% support at $58.50. A close above $70.20 would signal that my negative outlook is incorrect.
NuCor (NUE) has formed several large range negative candle formations this year, consistent with heavy selling. It looks ready to drop to the 50% support at $43.20, if not the $41.70 area. A close above $48 would be positive.
For Alcoa (AA), a drop below $16.44 would suggest a test of the key support at $15.72-$15.88. A daily close below $15.44 will project a drop to the 50% support at $14.20. Watch for a close above $17.80 to signal a turnaround for the stock.


