A closer look at how the major sectors have performed so far in 2011 can help to identify where the most promising opportunities will lie throughout the upcoming quarter.
March certainly was a wild month for the stock market, and those who impulsively hit the sell button as stocks were collapsing are likely now thoroughly disgusted.
The steady advance of the past week has been surprising, but it can best be attributed to underinvested money managers who need to be long the right stocks by the end of the quarter.
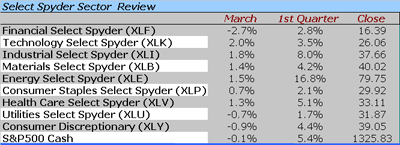
The monthly and quarterly sector performance data supports the perception that it was not an easy quarter to outperform the market averages. Clearly, the Select Sector SPDR - Energy (XLE) was the star performer, up 16.8% for the quarter, followed by the Select Sector SPDR - Industrial (XLI), both of which looked good technically in mid January. (See Two Top Sector ETFs.)
It is surprising that these two sectors were the only ones that outperformed the S&P 500 for the quarter. So can we expect any of the lagging sectors to emerge as the star performers in the second quarter?
Chart Analysis: The Select Sector SPDR
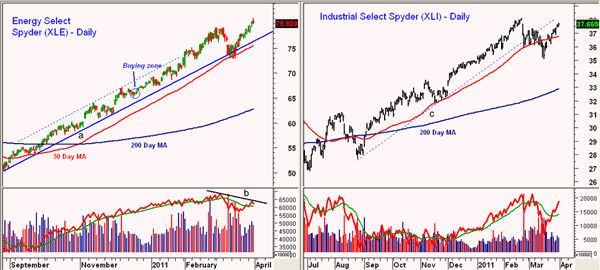
-Energy (XLE) finished the quarter by rallying to a new high for the
year in the first hour of trading on Thursday before closing lower for the day.
Even though the analysis of crude oil does look pretty strong, XLE may be ready
for an overdue pullback.
- The daily chart shows a well-established uptrend that was tested, along with the 50-day moving average (MA) on the mid-March drop. Initial support is now at $79 with stronger chart and retracement support in the $77-$77.80 area
- The rising 50-day MA is at $75.56 with key support at $72.90 and the mid-March lows
- The daily on-balance volume (OBV) does show a negative divergence, line b, which is consistent with a correction. The weekly OBV (not shown) is positive for the intermediate trend
The Select Sector SPDR - Industrial (XLI) is up 7.3% from the mid-March lows, but has not yet surpassed the February highs at $38.08. XLI is still also below the former uptrend, line c.
- XLI has initial support now at $37-$37.30 with stronger support at $36.50. It would take a close below the March lows at $35.08 to turn the chart negative
- The daily OBV is rising sharply and did confirm the February highs. The weekly OBV also looks strong
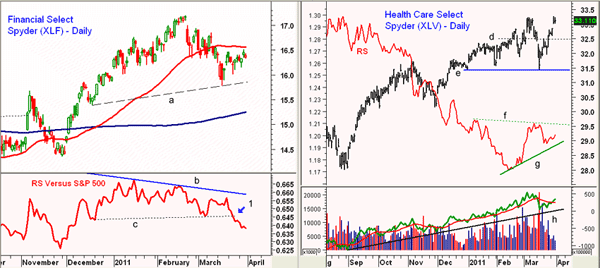
The Select Sector SPDR - Financial (XLF) was the weakest sector in March, down 2.7%. It was not much better for the quarter as the S&P outperformed XLF by 2.6%.
- The rally from the mid-March lows has failed to move above the flat 50-day MA, which is now at $16.56. There is stronger resistance at $16.80-$17.00
- The rally over the past 11 days looks like a continuation pattern, which suggests it is just a pause in the downtrend. A break below $16.16 will be the first sign that the decline in XLF has resumed
- A daily close below $16 should signal a drop to the $15.25-$15.40 area and the rising 200-day MA
- The relative strength (RS) analysis has been declining (line b) since September, consistent with the weakness in XLF. The RS has just dropped below the recent lows, line c, so XLF should still be avoided
(See Video: Find Big Winners with Relative Strength)
I have been watching the Select Sector SPDR - Health Care (XLV) since mid-January, and the 5.1% gain in the first quarter was not bad. I have been waiting for a breakout above the 2008 highs at $33.70 to signal a move to the $36.50-$38 area.
- The daily chart shows initial support in the $32.50 area (line d) with key support at $31.40, line e
- The RS analysis (overlaid on the bar chart) shows a potential bottoming formation as it has formed higher lows, line g. A move in the RS above resistance at line f will confirm that XLV has started to outperform the S&P 500
- The daily OBV is in a strong uptrend (line h) and the weekly OBV is acting stronger than prices
What It Means: For the upcoming quarter, the analysis suggests that Health Care should be one of the strongest sectors and the recent strength in the biotech sector supports this view. (See also "Biotech Fever Spreads.") Health care is considered a defensive sector, which may be telling us something more about the overall market.
I see no evidence of a major trend change for XLE, but a setback is likely to be a buying opportunity.
The Select Sector SPDR - Technology (XLK) has been lagging, but the growing negative sentiment may set up a good contrarian buying opportunity. I am also keeping an eye on the Select Sector SPDR - Materials (XLB) on a pullback.
How to Profit: Experienced option traders could use my analysis to establish bullish strategies when the ETFs decline into the recommended buying zones and should follow the same stops. I did expect XLF to test its 200-day MA but have no formal recommendation. The three ETFs XLE, XLV, and XLI look the best on pullbacks.
My remaining half long position in XLE from $65.80 was sold Wednesday as I raised the stop to $72.72 February 22 and recommended selling at $79.66. I was definitely lucky to not get stopped out on March 16. I would now look to buy XLE at $76.44-$77.07 with a stop at $72.72 (risk of approx. 5.6%).
For XLV, buy at $32.10-$32.68 with a stop at $31.18 (risk of approx. 4.6%). Sell half the position at $35.20 or better.
I would also buy XLI at $36.30-$36.74 with a stop at $34.92 (risk of approx. 5%). On a move above $38.14, raise the stop to $36.27 and sell half the position at $39.42.


