The biotech sector is back in favor, so today we look to the charts of a primary sector ETF and a pair of industry-leading stocks in search of ways to profit from the resurgence.
Many of the biotech stocks were having a good week even before the hostile $5.7 billion bid for Cephalon (CEPH) hit the tape on Wednesday.
Quite a few biotechs show gains of 10% or more just this week, and Dendreon (DNDN), which was featured in last Friday’s article “Bottom Fishing in Biotech,” is up 8.9% from last week’s close. The weekly charts are suggesting that the recent gains may be the start of a more important trend change.
All of the biotech ETFs that hold positions in Cephalon also surged, but most are too thin, in my opinion, while the iShares Nasdaq Biotech Index (IBB) is the most liquid and has a compelling long-term chart.
There are quite a few biotech stocks that have very nice looking charts with Human Genome Sciences (HGSI) and Celgene (CELG) both forming long-term triangle formations that suggest significant upside potential.
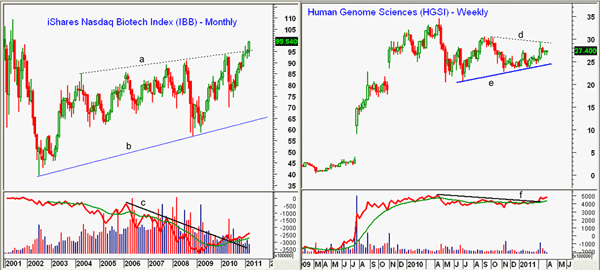
Chart Analysis: The monthly chart of iShares Nasdaq Biotech Index (IBB) shows that this month, we are going to close above seven-year resistance (line a). The 2001 highs were at $109.30, about 9.8% above Wednesday’s close.
- The gap on the daily chart from Wednesday’s trading lies at $97.85 to $98.72 with the breakout level on the daily chart at $96.50-$97. There is more important support now at $95.50
- The monthly on-balance volume (OBV) moved through its downtrend (line c) in early 2010, while the daily OBV (not shown) also shows an upside breakout
Human Genome Sciences (HGSI) is a $5 billion biopharmaceutical company that is known to be quite volatile with a beta of 4.1. The weekly chart shows that HGSI has formed a triangle formation (lines d and e) since last summer.
- The weekly resistance, line d, is in the $29.30 area, and a move above $30.45 should complete the corrective pattern. The April 2010 highs are at $34.49, while a completion of the triangle formation has upside targets in the $39-$40 area
- The sharp pullback from the March 10 highs has almost filled the gap on the daily chart. There is first support now at $26.20-$26.60 and then more important support in the $25.50-$25.80 area. The long-term uptrend (line e) is at $24.50
- The weekly OBV has traded in a tight range since last summer and has now moved through resistance at line f. It is already quite close to the April 2010 highs
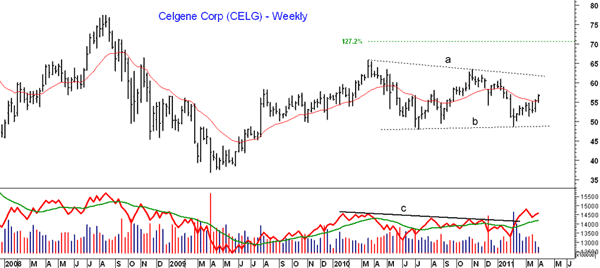
Celgene (CELG) is a much different biotechnology company than HGSI. It is a big-cap ($25 billion) Nasdaq 100 stock that concentrates its efforts on ways to treat cancer and immune inflammatory diseases. Its beta is also much lower, at 0.61, but it does have a chart formation similar to that of HGSI.
- CELG has been in a broad trading range since it peaked in March 2010 at $65.79. The July 2010 lows at $49.02 were just above the major 61.8% support level, as CELG bottomed in April 2009 at $36.90
- The weekly chart has next resistance at $58-$60.90 with the upper boundary of the triangle formation (line a) in the $62 area. A move above the November 2010 highs at $63.50 will confirm a resumption of the major uptrend
- The 127.2% Fibonacci target is at $70.85 with the all-time highs from 2008 at $77.39. The triangle formation gives upside targets at $79-$80
- The up-gap opening on Wednesday leaves initial support at $55-$55.70 with stronger support in the $53.50 area. There is more important support in the $52 area
- The weekly OBV is leading prices higher, having overcome major resistance, line c, in mid-February. The daily OBV is also positive
What It Means: The positive action in a high number of the biotech stocks suggests that the recent strength may last for some time. The large biotech stocks like CELG had a tremendous bull market from 2005-2007 but have been range bound for the past two years. Clearly, demographic issues are a positive factor for the biotech sector as a whole.
How to Profit: The sharp gains of the past few days will ultimately be followed by a decent correction since nothing goes straight up or down. I would wait for a pullback to buy IBB or CELG, but HGSI is just starting to move, so we might get a decent entry point. Remember, HGSI it is a very volatile issue that is not for the faint of heart.
For HGSI, buy at $27.04-$27.35 with a stop at $25.66 (risk of approx. 6.2%). On a move above $30.05, raise the stop to $26.44, and sell half the position at $31.33.
As noted earlier, CELG is considerably less volatile, and I would buy at $55.20-$55.82 with a stop at $51.88 (risk of approx. 7.1%). On a move above $58.15, raise the stop to $54.94. Sell half the position at $61.33.
As for IBB, go 50% long at $97.55-$98.10 and another 50% at $96.92 or better with a stop at $92.27 (risk of approx. 5.4%). On a move above $101.40, raise the stop to $96.23 and sell half the position at $103.88 or better.


