The world and financial markets are reacting to news about the Japan earthquake and resulting tsunami. Here’s what to watch for in key Asian markets as well as in the US.
The powerful overnight earthquake in Japan and widespread tsunami warnings throughout the area are likely to add more pressure on the already weak Japanese and Hong Kong stock markets. Both lost over 1.5% in Friday’s session. Japanese stocks have been receiving quite a bit of attention recently, as some managers have commented that Japanese stocks are undervalued. The charts suggest they are unfortunately likely to drop further over the next few weeks. The US markets, after Thursday’s pummeling, are also likely to be under further pressure on Friday, though technically, they look much stronger.
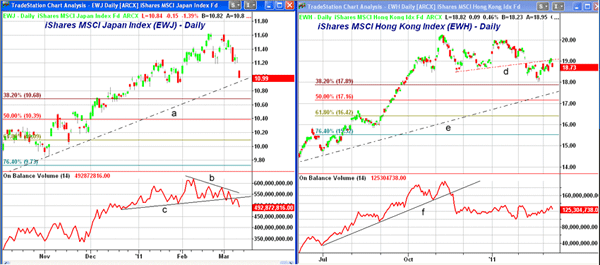
Chart Analysis: The iShares MSCI Japan Index (EWJ) gapped lower on Thursday and is likely to show another down gap Friday and break the daily uptrend, line a.
- The daily chart shows further support in the $10.80 area with the 38.2% support level at $10.68
- The more important 50% support is at $10.38 with the rising 200-day moving average (MA) at $10.22
- The daily on-balance volume (OBV) peaked in early February and formed a negative divergence at the highs (line b). The OBV dropped through support, line c, early in the week
- There is initial resistance now in the $11-$11.20 area
The iShares MSCI Hong Kong Index (EWH) peaked on Nov. 8, 2010 and has been correcting while many of the other world markets have made a series of new highs.
- EWH tested the $18 area in late February before rebounding to trend line resistance, line d, in the $19.15 area
- Thursday’s lower close suggested the rebound was over with the next target at $17.98 and the 38.2% support
- The longer-term uptrend (line e) and the 200-day MA are at $17.50 with the 50% retracement support at $17.16
- The daily OBV violated its uptrend, line f, in November, and has since been in a fairly narrow range
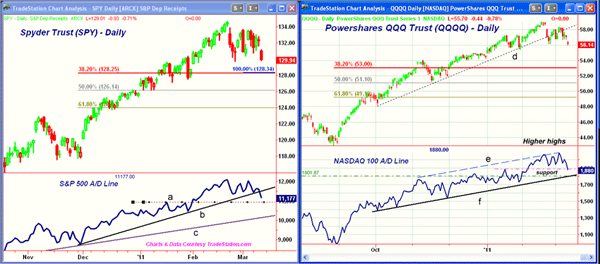
The chart of the Spyder Trust (SPY) looks much stronger than EWJ or EWH as it made significant new highs in February and is still above the late February lows.
- The daily chart shows next good support in the 128.25-34 area which is the short term 38.2% support as well as the equality target derived from the earlier decline.
- There is additional support in the $127.50 area with the 50% retracement support at $126.14.
- The chart has first resistance now at $131 with stronger in the $133.50 area
- The S&P 500 A/D line did confirm the price highs which is bullish for the intermediate term trend.
- The A/D line made s secondary high on March 3rd before turning lower and breaking its initial uptrend, line b. It is just above next support (line a) with more important support at line c.
The Powershares QQQ Trust (QQQQ) tracks the Nasdaq 100 index, which has been the strongest US market sector. It has been hit hard with profit taking over the past few days, as it gapped below the 50-day MA on Thursday.
- The next support is at $55.30-$55.50 with further support at $54, which corresponds to the highs from last November
- The 38.2% support is at $53 with the 50% retracement support at $51.10. The rising 200-day MA is at $50.50
- The Nasdaq 100 Advance/Decline (A/D) line made further new highs on March 3 (line e) as it was stronger than prices. It is already back to first support, with stronger support at the uptrend (line f) dating back to the October lows
What It Means: The weak technical picture for EWJ and EWH makes them more vulnerable to the impact of the earthquake and tsunami. I remember the weaker 1995 Kobe earthquake quite well, as I was writing daily commentary on both the Japanese and Hong Kong markets at the time. The economic impact of that quake was pegged at $100 billion, and a similar economic loss this time could seriously derail Japan’s economic recovery.
As for the US market, the short-term A/D indicators are reaching oversold levels, suggesting a short-term low in the next few days. Also, American Association of Individual Investors (AAII) sentiment is currently neutral, with only 36% bullish and 32.3% bearish. Next week, the number of bulls should drop even more. This would put the sentiment numbers closer to levels consistent with a market bottom, not a top. They are quite different from the 63% bullish reading in late December.
How to Profit: If you are still long either EWJ or EWH, I hope you determined an appropriate stop before this disaster. The opening price could be the low for the day, but both markets should stabilize, if not bounce, in the next week. A weak rebound in EWJ would be a reason to sell.
Technically, EWH has been correcting for some time and could bottom out in the next several weeks. As for SPY and QQQQ, the intermediate-term picture remains positive, while the short-term outlook favors further weakness. The strength of the next rally, which should begin next week, will be important.


