Trends are considered the most favorable of conditions for traders because of a number of reasons, which James Stanley of DailyFX.com outlines in detail using price action.
Why Trends?
Of the three possible market conditions, trends are often considered to be the most desirable for a few different reasons.
As we explained in our introduction to price action, future price movements are unpredictable. Price action merely gives traders a clear and concise view of the market so that they can look to implement strong risk-reward ratios in their strategies.
This is why trading in trending environments can be so attractive. If the trend is to continue, the trader can reap three, four, or five times the initial risk that was used to enter the position…and if the trend isn’t going to continue, the trader can look to cut their losses quickly.
Using price action to trade in a trending market is a simple and non-threatening way for traders to look to avoid the Number One mistake that forex traders make.
Further—trading trends via price action is a way to decrease ‘guess-work’ with fundamental analysis.
If fundamentals are improving for an economy, then traders will generally look to buy in anticipation that those fundamentals may, eventually, bring on higher rates in that economy.
As traders move prices higher with increasing demand, price action will show the uptrend with higher-highs and higher-lows; and if those rate expectations are to continue to increase and if the fundamental news is going to continue to improve, the rational expectation is that the trend will also continue to move higher.
Threading the Needle with Multiple Time Frame Analysis
Traders can use multiple time frame analysis to get two different vantage points of a market; with the primary goal being to enter trades and trigger positions in terms of the bigger picture trend.
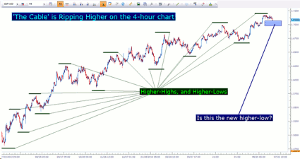
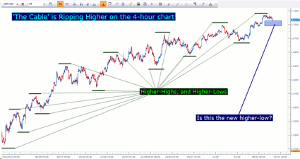
Rather than basing the entirety of a trader’s decisions on a single time frame, traders can look to a longer-term chart to determine the general condition and trend of that market. In the 4-hour chart below, we’re looking at GBP/USD making continual higher-highs and higher-lows over the past year:
Uptrend in GBP/USD over the past year

Created with Marketscope/Trading Station II; prepared by James Stanley
Click to Enlarge
As you can see in the above chart, GBP/USD has been on a tear since July of 2013, putting in a +2200 pip uptrend; and this is shown via price action with the continual higher-highs and higher-lows.
When a situation like this presents itself, the trader should look for opportunities to go long so that if this +2200 pip trend can continue, they can look to take part in the move.
The only question is whether or not a new higher-low has actually been made on this longer-term chart, and the answer to that will never be known until it’s too late. But this is the advantage of price action; the premise of whether or not this is going to be a higher-low can allow the trader to look for a risk-efficient entry.
NEXT PAGE: Enter at Your Own Risk
|pagebreak|Executing the Entry
As we said above, you’ll never know whether a higher-low has been set until after price action has proven that the trend will continue: But the hypothesis that a higher-low may have been set is enough for traders to assimilate risk management of a potential position.
In the below chart, we’ve moved down to the hourly time frame so that we can more accurately plan an entry in the same market we had looked at above.
The hourly chart presents greater granularity for plotting and planning the entry

Created with Marketscope/Trading Station II; prepared by James Stanley
Click to Enlarge
Traders can watch the shorter-term chart to begin planning their entries; and in the event of an uptrend, as was seen above, traders want to wait for support to be set (the higher low) so that they can look to buy with a stop just below that higher-low.
What allows this to Work—and why are Trends so desirable?
As we’ve said a few different times in this article, future price movements are unpredictable; and the goal of price action analysis isn’t to get a 100% accurate forecast of what will happen because nothing in this world can offer that.
Rather, this is simply a way for traders to look to get the probabilities of success on their side, if even just a little bit by getting the most clear and concise view of a market.
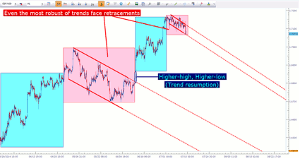
Make no mistake about it; retracements can last for a prolonged period of time. Case-in-point, check out the down-trending channels in the same GBP/USD chart we looked at just a moment ago:
Traders can wait for higher highs and lows to show on entry chart before triggering position

Created with Marketscope/Trading Station II; prepared by James Stanley
Click to Enlarge
What allows trend trading via price action to work so effectively for some traders is the fact that if and when they’re on the right side of the trade, they can reap far more than they had to risk to get into the position.
This could be a risk-reward ratio of 1-to-2, 1-to-3, or 1-to-4. Traders can look to ‘scale-out’ of positions as trades move further in their favor; even adding a break-even stop to ensure against taking a loss in the position should prices happen to turn around.
If a trader is able to average out of their positions with a 1-to-2 risk-to-reward ratio, they need to be right approximately 33% of the time to break-even; spreads or commissions not included. If a trader wins $2 when they’re right, but loses only $1 when they’re wrong—well if they win 40% of the time, they stand a legitimate chance at making a profit: These traders don’t need to win 60 or 70% just to get a chance to breakeven on their strategy.
By James Stanley, Trading Instructor, DailyFX.com


