Since it seems that the current wall of worry may have kept many out of the market and that another run to the upside might still be a possibility, MoneyShow's Tom Aspray offers a review of the Dow Theory and a technical outlook for the major averages.
All it took was some surprisingly bad economic data to reverse the stock market's short-term slide on Wednesday. The final first quarter GDP came in at -2.9%, which was a shock to most economists who, according to a Bloomberg survey, were looking for a decline of just 1.9%. In terms of the economy, the GDP focus now turns to the preliminary second quarter estimate that will be released on July 30. The Durable Goods were also much weaker than expected.
The Dow Jones Transportation led the market once again as it was up 0.88% as only the oil service sector did better. The market internals were better than 2-1 positive as the NYSE Advance/Decline line made another new high. The rally may be due, in part, to portfolio managers scrambling to get invested in the market before the end of the quarter. Many have probably not followed the bullish signals from technical studies like the A/D line.
Just a day ago, one of the leading financial networks ran a headline Is the Bull Run Over? This is the wall of worry that has kept many out of the market and another run to the upside is still a possibility. A review of the Dow Theory and a technical outlook for the Industrials and Transportation averages may be making portfolio mangers even more nervous.
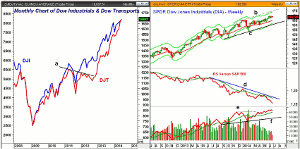
Chart Analysis: The monthly close only chart of the Dow Industrials and Dow Transportation averages shows their dramatic rally from the 2009 lows.
- Both averages are ready to close the month at another new high and show a pattern of higher highs and higher lows since early 2013.
- The Transports had diverged from prices from the middle of 2011to early 2013 as indicated by line a.
- The reasons why this was not a bearish sign was that the Transports never formed a pattern of lower lows and lower highs, the definition of a downtrend.
- The Dow Industrials have tested June's monthly projected pivot resistance at 16,992 but many are waiting for a move above 17,000.
- For July, the pivot resistance tentatively is at 17,144.
- On the other hand, the Transports did not reach their monthly pivot resistance, which, for July, is at 8423.
- It would take a severe decline and quite a bit of time before the Dow Theory could give a sell signal.
The weekly chart of the SPDR Dow Industrials (DIA) shows the brief drop below the weekly starc- band in early February.
- This low forms the basis for the weekly uptrend, line c.
- Since the February lows, the DIA has held above the 20-week EMA on a closing basis.
- This EMA is now at $164.77 with July's projected monthly support at $166.55.
- The weekly starc+ band is at $173.69 with the upper boundary of the trading channel (line b) at $174.62.
- I thought that the relative performance could be bottoming in the spring.
- By the end of May, the RS line had violated key support and the downtrend, line d, is still intact.
- The weekly OBV broke out to new highs in early May and, while it is clearly positive, it has been showing great strength.
- The weekly OBV is still above its WMA and the daily (not shown) just moved above its WMA Wednesday, generating an AOT buy signal.
NEXT PAGE: An Index and an Individual Home Improvement Supplier to Watch
|pagebreak|The daily chart of the iShares Transportation Average (IYT) continues to outperform the Industrials as it is up 11.47% YTD while DIA is just up 2.78%. It has been a favorite since early in the year (3 Transport Picks Ready to Breakout).
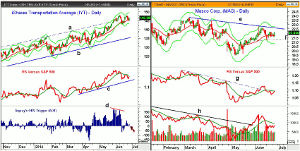
- Over the past three weeks, IYT appears to have formed a continuation pattern.
- A strong close above $147.72 would complete the formation with upside targets in the $152.50 area.
- The monthly projected pivot resistance for July is at $151.10.
- IYT tested its 20-day EMA on Wednesday before closing higher.
- There is further support at $143 and a decisive close below this level could signal a drop to the preliminary third quarter pivot at $141.90.
- The daily relative performance peaked ahead of prices in May.
- The RS line has turned up but is still below its WMA.
- The weekly RS line (not shown) is still well above its WMA.
- The Aspray's OBV Trigger (AOT) formed lower highs (line d) but this is not a divergence since IYT also made lower highs.
- The daily OBV moved back above its WMA Wednesday so a higher close Thursday would be bullish.
Masco Corporation (MAS) is a $7.9 billion maker of building materials and home improvement materials. It has a current yield of 1.7% and is 7.12% below its 52-week high.
- MAS tested the daily starc- band last week with its low at $21.25, line f.
- A high close doji buy signal was triggered Wednesday as it closed at $22.04, which was above Tuesday's doji high at $21.90 as well as the quarterly pivot at $22.02.
- A close above $22.32 should be enough to signal a completion of the recent flag formation.
- This would give targets in the $23.50-$23.70 area and July's monthly pivot resistance is currently at $25.72.
- The relative performance broke its downtrend, line g, suggesting that it was in the process of becoming market leader.
- The RS line is very close to moving back above its WMA.
- The daily OBV broke through its long-term resistance, line h, in May.
- The daily OBV is still below its WMA while the weekly looks ready to close above its WMA this week.
What it Means: Even though the major averages have continued to make a series of new highs, Lipper reported last week a net outflow of $1.184 billion from domestic equity funds.
The very weak GDP data likely gives the individual investor another reason not to buy stocks.
The portfolio managers also seem to be underinvested and they may need to load up their portfolios before the end of the month.
In my review of the Charts in Play portfolio, I noted that it is important that you decide which of your investments are core positions and are not. This will allow you to apply the best risk management strategy.
The iShares Transportation Average (IYT) is still one of the best performing ETFs, so far, in 2014.
How to Profit: For Masco Corp. (MAS), go 50% long at $21.93 and 50% long at $21.75 with a stop at $20.94 (risk of approx. 4.1%).
Portfolio Update: Should be 100% long the iShares Transportation Average (IYT) at an average price of $130.47 with a stop at $137.67.


