The market seems poised to move even higher though the weakness in crude oil is still a problem and MoneyShow's long term bull Tom Aspray sees some other potential warning signs on the horizon that investors should be aware of.
The impressive rally from the October 15-16 lows looks ready to push the S&P 500 and Dow Industrials up close to 2% for the month. The strength and relentless nature of the rally has surprised many, especially those who were looking for a new bear market.
The negative technical divergences at the early September highs warned of a correction, which I thought would be a buying opportunity. The decline was sharper than I expected so, in my early October column Will the October Curse Spook Investors Again? I wondered whether we would see even more panic selling.
On October 15, there were clear signs of panic selling and forced liquidation as many hedge funds were apparently on the wrong side of both crude oil and the bond markets. The sharp decline was not confirmed by some of the technical studies, which turned positive on Friday, October 17. The strong readings from the market internals the following week pushed the A/D lines above resistance on October 21, which generated stronger buy signals.
On Friday, the Nasdaq Composite reached its highest level since March 2000, and with earnings stronger than expected, the market seems poised to move even higher. As I pointed out last week, my main concern was that continued weakness in crude oil could derail the stock market’s rally as the energy sector continues to be a drag on the market.
Friday’s better than expected earnings from Exxon Mobil (XOM) and Chevron Corp. (CVX) helped to soothe the market as refining profits offset declining crude oil prices and lower production. Both stocks need to rally further to confirm that their corrections are really over.
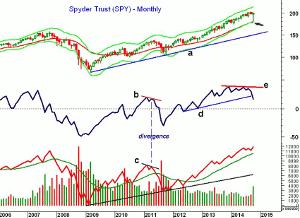
However, the heavy volume on the recent decline has weakened some of the longer-term technical studies for the major averages. The monthly chart of the Spyder Trust (SPY) shows that it came quite close to its monthly starc- band and its 20-month EMA in October.
The monthly Demand Index (DI), which was featured in last week’s Trading Lesson, has failed to make new highs this year as indicted by line e. In October, the DI dropped below its uptrend (line d), indicating that the selling pressure is now greater than the buying pressure.
The slight divergences in the DI and OBV in 2011 (lines b and c) were followed by a five month market correction so the current rally needs to be watched closely. The monthly OBV has made another new high and is not diverging from prices.
It is a concern that the weekly and daily OBV studies (see the What to Watch section) are still well below the September highs. They will need even higher prices and heavier volume in order to confirm new price highs. This will make the next several weeks quite important.
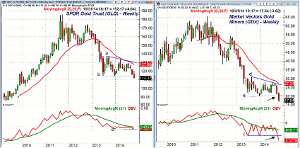
It has been a rough few months for those who have been long either the SPDR Gold Trust (GLD) or the Market Vectors Gold Miners (GDX) as they are down 7.7% and 31.2% respectively. In the October 24 column I Hope Gold Owners Followed the Plan... I reviewed why my earlier analysis concluded that both were heading lower.
The monthly chart of the SPDR Gold Trust (GLD) shows that the monthly flag formation (lines a and b) was completed with last Friday’s close. As expected, the close below $117.53 did trigger heavier selling.
The 4th quarter projected pivot support is at $107.06. The monthly OBV has been below its WMA since late 2012 and is close to breaking the key support at line c.
The Market Vectors Gold Miners (GDX) looks even weaker as it has closed well under the important support, line e, just above $20. The quarterly projected pivot support has already been reached with November’s pivot support (courtesy of John Person’s software) at $13.82.
The width of the flag formation has downside targets in the $10-$12 area. The monthly OBV has dropped well below the support at line f, as it has been leading prices lower. The daily and weekly OBV (not shown) also look very weak.
The action in the precious metals is consistent with the global deflation fears that are primarily focused on Europe. Sweden made the mistake of raising rates in 2010 and 2011, which put them near the top of the deflation watch list. Their prices have fallen in 16 of the last 24 months. They cut their interest rates to zero last week in the hope of recovering from their mistake. I hope the ECB and Germany are paying attention.
NEXT PAGE: What to Watch
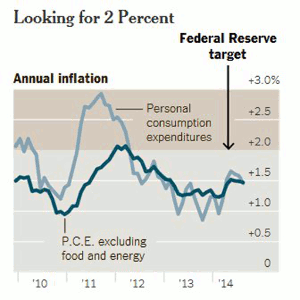
|pagebreak|As I noted last week, deflation is also a concern in the US. Last Friday’s Personal Income and Outlays report showed little change as these two Fed favorite inflation gauges are hovering around 1.5%, which is well below the Fed’s target rate of 2.0%.
A bit more encouraging was the Employment Cost Index that jumped 0.7% for the second quarter in a row last Friday. Wages and salaries are showing the sharpest rise since the end of the recession.
The surprise new stimulus from the Bank of Japan helped propel the global stock markets even higher on Friday. The BOJ boosted their asset purchases for the first time in a year and Japan’s NK225 made a new high for the year.
Overall, the economic data last week was pretty good as both the Conference Board’s Consumer Confidence and the University of Michigan’s month ending Consumer Sentiment reached their best levels since 2007. The Consumer Confidence in September disappointed the markets but the latest reading at 94.5 was a new recovery high.
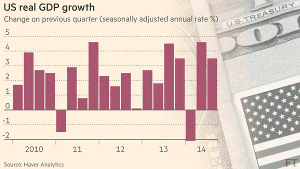
The advance reading on the 3rd quarter GDP came in at 3.5%, which was well above the consensus estimates of 3.0%. It was well below the 2nd quarter, which was boosted by the poor winter related growth in the 1st quarter. Still, the trend bodes well for the economy.
The economic calendar is full again this week with the PMI and ISM Manufacturing Indexes out Monday along with Construction Spending. This is followed on Tuesday with Factory Orders and the ADP Employment Report on Wednesday. Also on Wednesday we get the ISM Non-Manufacturing Index.
Productivity and Costs come out on Thursday and improving productivity growth often translates into higher wages. On this Friday, we get the monthly jobs report and only a sharply lower number is likely to jar the markets.
What to Watch
For a change, any of you that looked at your 401k or brokerage statements over the weekend are likely to be happy as long as you weren’t short. In the face of such a powerful week, with stocks like Linkedin Corp. (LNKD) up over 12% Friday, it is tough to find fault with this market.
I have been looking for a pullback to see if a good risk entry point emerged in the market tracking ETFs but that has not happened. Now I am much less interested in buying as I am probably one of the few long-term bulls that has some concerns about the stock market’s action.
With the level of selling on October 15, I would have expected to see more signs of bearishness from the individual investor. The fact that the bullish % jumped with the McClellan oscillator buy signals a few days after the lows suggested that the normally wrong individual investors might be right.
There was little change in the latest AAII survey with 49.37% bullish and 21.07% bearish. Listening to the financial media, they seem to be comfortably bullish at current levels especially with the mostly positive earnings reports.
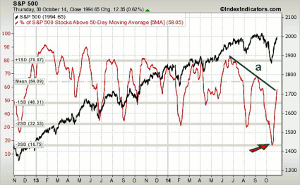
The 5-day MA of the number of S&P 500 stocks above their 50-day MAs hit its low on October 17 (see arrow) and rose to 58.05% on Thursday, breaking its downtrend, line a. It is still below the mean at 64.09%.
The main concerns I have about the market are based on the weakness in my volume analysis that I have been pointing out since mid-way through the correction. The lagging daily volume is often not a concern but, as I detail below, it’s the potential topping formations in the weekly OBV that makes me more cautious, even though the market internals are strong.
Let’s look at the evidence and then read my conclusions in the Week Ahead section at the end of today’s column.
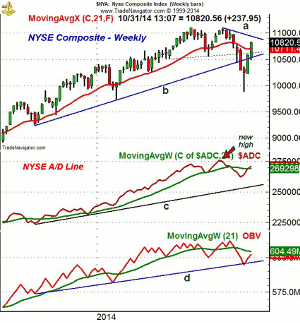
The weekly chart of the NYSE Composite (NYA) shows that it closed well above the 20-week EMA this week but is still below the short-term downtrend, line a, at 10,950.
The NYSE looks ready to close back above the 4th quarter pivot at 10,789 with the weekly starc+ band at 11,086. The September high was at 11,108 with the quarterly projected pivot resistance is at 11,340.
There is initial support at 10,600-10,750 with the 20-day EMA at 10,562.
The weekly NYSE Advance/Decline line has moved back above its slightly declining WMA but is still well below the late August high. Therefore, it is possible that the NYSE could make a new high in the next few weeks that would not be confirmed by the weekly A/D line.
The daily NYSE A/D line (not shown) is also well below its previous high but has broken its downtrend. The McClellan oscillator is still holding above the +200 level after completing a classic bottom formation just after the lows.
The weekly OBV has turned up from support, at line d, but is still well below its declining WMA. It would take very strong volume over the next few weeks to push the weekly OBV to new all time highs.
NEXT PAGE: Stocks
|pagebreak|S&P 500
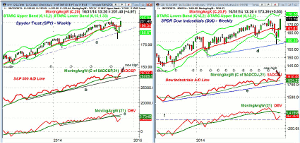
The Spyder Trust (SPY) came very close to the September 19 high of $201.90 but did not exceed it on Friday. The three week reversal to the upside is impressive on the weekly chart as it did have a new high weekly close.
The SPY is still well below the daily starc+ band at $204.53. The weekly starc+ band is at $205.04 with the quarterly pivot resistance at $208.43.
The weekly S&P 500 A/D line made a new high last week as the uptrend, line b, was tested on the recent decline. The ability of the daily A/D line to overcome its downtrend two weeks ago was a very bullish sign.
The weekly on-balance volume (OBV) dropped below its uptrend, line c, in early October. The OBV has turned up but is still below its slightly declining WMA. The daily OBV (not shown) is above its flattening WMA but well below the September highs.
There is minor support now at $198.50 with the quarterly pivot at $196.19. The now rising 20-day EMA is at $193.90, which is over 3.5% below current levels.
Dow Industrials
The SPDR Dow Industrials (DIA) made a high on Friday of $173.63, which was just slightly above the September high of $173.32. The daily starc+ band is at $174.59 with the weekly at $176.53. The quarterly pivot resistance is at $179.49.
The weekly and daily Dow Industrials A/D lines both made new highs last week.
The weekly just tested its rising WMA on the correction.
The weekly OBV dropped to longer-term support from late 2013, line f, on the recent decline. The OBV has been rising for the past two weeks but is below its declining WMA. It is even further below its all time high.
There is first support now at $170-$171 with the quarterly pivot at $168.61.
Nasdaq 100
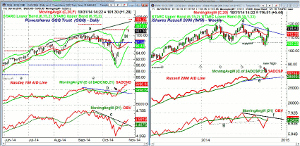
The daily chart of the PowerShares QQQ Trust (QQQ) shows the sharp upgap opening last Friday as it closed at new highs. It did close above its quarterly pivot at $97.59 last week.
October’s projected resistance was hit on Friday with the daily starc+ band at $103.08. The quarterly pivot resistance is at $104.74, which is close to the upper trend line resistance at line a.
The daily Nasdaq 100 A/D line has continued to move sharply higher after breaking through the resistance at line b. It is now well above the previous highs.
The weekly A/D line (not shown) has also made new highs.
The daily OBV broke its downtrend, line c, last week but is well below the September highs. The weekly OBV is also lagging prices as it is below its slightly declining WMA.
The first daily chart support is in the $100 area with the 20-day EMA at $97.59.
Russell 2000
The iShares Russell 2000 Index (IWM) has had a very impressive rally after dropping below the weekly support that went back to early 2014. The weekly downtrend, line d, has been convincingly overcome as the weekly starc+ band and quarterly pivot resistance have been reached. The IWM is just below the early September high.
The weekly Russell 2000 A/D did make a new high last week as did the daily A/D line, which is rising very sharply. The key support for the weekly A/D line is at line e.
The weekly OBV has moved back above its flat WMA but is still below the downtrend, line f. The OBV has regained the long-term support at line g, which was broken in the latter part of September.
The first real support is in the $113.50-$115 area, with the 20-day EMA at $110.93.
NEXT PAGE: Sector Focus, Commodities, and Tom's Outlook
|pagebreak|Sector Focus
The iShares Dow Jones Transportation (IYT) made a convincing new high last Wednesday but failed to make a higher high on Friday. Once above the all time high at $157.64, the daily starc+ band is at $162.76 with the monthly pivot resistance for November at $163.76.
Both the weekly and daily OBV have made new highs with prices and are well above their WMAs. On both time frames, the relative performance analysis continues to indicate that IYT is a market leader.
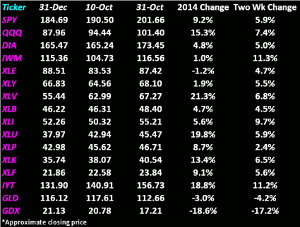
It has been an impressive three weeks as both the iShares Dow Jones Transportation (IYT) and iShares Russell 2000 Index (IWM) are up over 11% with IWM now positive for the year.
For the year, the leader is the Select Sector Health Care (XLV), which is up over 21% followed by the 19.8 gain in the Select Sector Utilities (XLU). The PowerShares QQQ Trust (QQQ) is now up over 15% for the year.
The Select Sector Technology (XLK) is up 13.4, while the Spyder Trust (SPY) is now up 9.2 for the year. The SPDR Dow Industrials (DIA) is back in positive territory and up 4.8% for the year.
Interest Rates
The yield on the 10-Year T-Note continued to move higher closing at 2.33% for the week. The 20-day EMA of the yield is at 2.44%, which is next resistance.
The Week Ahead
The stock market held most of its gains into the close last week, which should be a positive for this week. It is really a mixed technical picture as, while the weekly A/D lines (other than the NYSE) look strong, the OBV analysis does not.
We are entering a seasonally strong period, but since everyone knows this, it may already be factored into the market. The recent market strength may be partially a result of the conviction that the Republicans are going to take over the Senate in the mid-term elections.
This may be right, but if they are not able to do anything when they are in control, it will not bode well for 2016. If the increasingly less reliable polls are wrong, and the Democrats hold on to the Senate, the market could get hammered.
As I noted a few weeks ago, there are no signs of a recession and the Fed has not began to tighten so a bear market is not in the cards at this time. Therefore, those who bought low expense ETFs as part of the dollar cost averaging program should just sit tight and ride out another market decline if it occurs.
For the shorter-term traders, I would advise not getting caught up in the bullish enthusiasm and trade the long side lightly for the next few weeks until the divergences I noted earlier are resolved.
Be sure to monitor my Twitter feed for up to date changes in the market outlook.
Don't forget to read Tom's latest Trading Lesson, Demand Success from Your Portfolio.

