Even though the fear level was reduced with last week's market strength, the technical outlook for one key market is still a reason for concern, so MoneyShow's Tom Aspray studies the charts to see if this market will drop further and put new pressure on the stock market.
The wide market swings of the past eight days in the stock market have likely scared the average investors and kept them from buying stocks. This will keep the public's participation in the stock market at low levels. This is not surprising as many professionals are also likely confused as they wondering whether they should be buying or selling.
Just a week ago, the sentiment in the financial media was decidedly negative with only a few of the longer-term value oriented analysts interested in buying. Several well known analysts proclaimed a new bear market was underway. With Thursday's sharp gains, the consensus now seems to be that the market's correction is over.
The Fear & Greed Index that I reviewed in early August's Are the Fear Levels Really That High? is now at 13, which is an extreme fear reading. Back in August, it was even lower at 4. I have not studied this enough to be convinced that this is a contrary indicator but the low reading in August came just after a round of panic selling.
Clearly, there were signs of panic liquidation on Wednesday, October 15 as the Spyder Trust (SPY) dropped to a low of $181.92 before closing at $186.43. As of last Thursday's close, the SPY was up 7.1% from the intraday lows. The yield on the 10-Year T-Note also briefly dropped well below 2%.
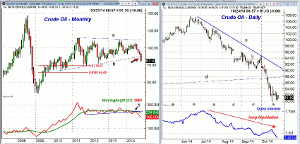
Though the fear level has clearly been reduced with last week's market strength, the technical outlook for the crude oil market has me concerned as lower crude oil could again pressure the stock market. The monthly chart of the crude oil futures shows that it is likely to close below the important support in the $87 area, line b.
Everyone is currently focused on the $80 area but the next strong monthly chart support is in the $75 area with the 50% retracement level at $74.07. Crude is currently testing its monthly starc- band, so prices could consolidate before they move lower.
The monthly OBV dropped below support in March and then rallied back to its flat WMA in June (point 1). This was a classic Aspray's OBV Trigger (AOT) sell signal. The OBV has since dropped sharply over the past three months and is now acting much weaker than prices.
The daily chart of crude shows the $14 plunge in prices since the start of October. For the past eight days, prices have traded in a broad range but there are no strong signs yet that the selling is over.
The open interest has been declining steadily since it peaked in early July, which indicates the selling has been due to the liquidation of long positions. This is less negative than a rising open interest, which would suggest new shorting of crude oil was pushing prices lower. Eventually, all of the weak long positions will be sold and then a bottom could be formed.
Deflationary fears contributed to the recent market decline and late last year I thought the threat of deflation might be enough for the Fed to postpone their plans to taper. Another $5 per barrel drop in crude oil is likely to cause further concerns.
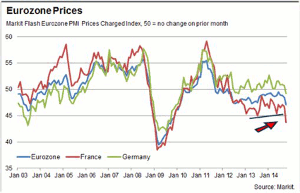
The recent data from Markit on EuroZone prices is also not encouraging as the PMI Prices Charged Index for France plunged in the latest reporting period as the support, at line a, has been violated The near term trend for the EuroZone and Germany is also negative as they are at or below the early 2013 lows.
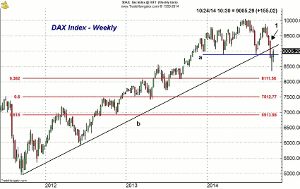
The Germany's DAX Index has also had a nice rebound from the October 16 low of 8354 as it is up over 7.5%. With Friday's slightly lower close, the rally is still below the former uptrend, line b. It has been able to move back above the twin lows, line a. A close above the 9350 level, point 1, should be enough to confirm that the correction is over.
The economic data last week was generally positive as Existing Home Sales rose 2.4% and the Chicago Fed National Activity Index jumped from minus 0.25 to plus 0.47. The PMI Flash Manufacturing Index softened a bit in October.
The all important Leading Economic Indicators (LEI) rose 0.8% and, as I argued three weeks ago in Stocks Drop, But Has Anything Really Changed? it shows no signs of an impending recession. It is my favorite and most reliable economic indicator.
NEXT PAGE: What to Watch
|pagebreak|There is a full economic calendar this week starting Monday with the PMI Services Index, Pending Home Sales Index, and the Dallas Manufacturing Index. These reports are followed on Tuesday by the Durable Goods Orders, the S&P Case-Shiller HPI, and Consumer Confidence, which declined last month.
The FOMC meeting also begins on Tuesday with their announcement on Wednesday afternoon. On Thursday, we get the advance reading on 3rd quarter GDP. There is also plenty of news to move the markets on Friday with the Personal Income and Outlays, Employment Cost Index, Chicago PMI, and Consumer Sentiment.
What to Watch
The continued strength in the stock market last week was consistent with the confirmation of a bottom in the short-term technical studies that were discussed in last week’s column. It has gone further than I expected without a pullback and more positive technical signals have been generated.
More of the bears have been squeezed out of the market as several key technical levels have been overcome. However, the market is now reaching even stronger resistance, which makes a 1-2 day pullback increasingly likely this week.
The individual investor became even more bullish last week. In Thursday’s poll release, 49.69% were bullish compared to 42.66% last week. The increased bullishness last week, as I pointed out in Is the Individual Investor Right?, suggested that the individual investors may have been buying near the market lows.
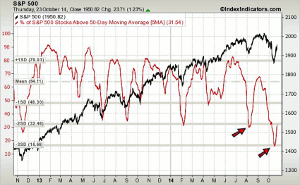
The 5-day MA of the number of S&P 500 stocks above their 50-day MAs dropped to a low of $15.43% on October 17 and closed at 31.54% on Thursday. This completes the bottom formation I have been looking for over the past few weeks. It is still well below the mean at 64.11%.
With the strong rally last week, there are likely to be several key ETFs that will generate positive signals by closing back above their quarterly pivots. The full table of quarterly pivots can be found at last week’s article.
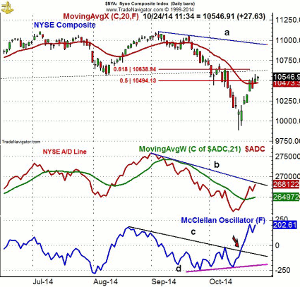
The decline of the NYSE Composite (NYA) held above the important chart support at 9732, which was the February low. The major 38.2% Fibonacci support from the June 2012 low at 9611 also held.
The 50% retracement resistance from the September 4 high has been overcome with the 61.8% retracement resistance at 10,638. The 4th quarter pivot is at 10,789 and the downtrend from the highs, line 1, is at 10,950.
The daily NYSE Advance/Decline line shows a bullish zig-zag formation but has not yet broken the downtrend, line b. The WMA of the A/D line has turned up, which is consistent with a bottom.
As I noted last week, the McClellan oscillator confirmed its three week bullish divergence (line d) by the strong move above the downtrend, line c, and the zero line. The sharp move to above +200 is a sign of strength.
There is initial support now at 10,474 and the 20-day EMA with further at 10,370.
NEXT PAGE: Stocks
|pagebreak|S&P 500
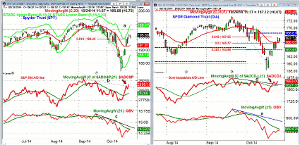
The Spyder Trust (SPY) closed above the 61.8% retracement resistance level last Thursday as the quarterly pivot at $196.19 is being tested. There is further resistance now at $198, line a, with the daily starc+ band at $199.47.
Users of the starc bands should note that both the daily and weekly were tested at the correction lows.
The daily S&P 500 A/D line has moved above the bearish divergence resistance, at line b, which I noted last time would signal that the correction was over. The WMA is also now clearly rising, which is another plus.
The daily on-balance volume (OBV) continues to lag as it is now just testing its WMA and is still below the downtrend, line c. The weekly OBV (not shown) has turned up but is still below its WMA, which is now declining.
There is initial support now at $194.20 with the now rising 20-day EMA at $191.79.
Dow Industrials
The SPDR Dow Industrials (DIA) has also had a strong rally as both the 38.2% Fibonacci retracement resistance at $163.98 and the 50% resistance at $165.77 have been overcome.
The 61.8% resistance is at $167.55 with the quarterly pivot at $168.61. There is additional resistance at $170.69, which was the early October high.
The Dow Industrials A/D line held well above the August lows (line d) on the correction and has rallied sharply over the past week. The bearish divergence resistance, at line d, has been decisively overcome and it shows a bullish zig-zag formation.
The daily OBV is still well below the highs it made in September and it has not yet moved above its WMA, which is trying to flatten out.
Nasdaq 100
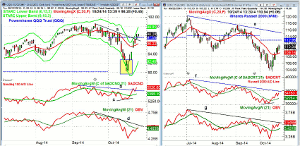
The PowerShares QQQ Trust (QQQ) opened above its downtrend, line a, last Thursday and continued higher. It looks ready to close back above its quarterly pivot at $97.59. The daily starc+ band is now at $99.85 with the preliminary monthly projected pivot resistance for November at $101.29.
There is initial support at $496.80-$97 with the rising 20-day EMA at $96.22. The daily starc- bands were tested (see box) at the correction lows, indicating it was a low risk buy and a high risk sell.
The Nasdaq 100 A/D line has turned positive after breaking through the downtrend, line b, from the September highs. It could make a new all time high in the next week or two. It did form a short-term positive divergence at the lows, line c.
The daily OBV is back above its WMA but is lagging the price action. The weekly OBV (not shown) is still well below its WMA but has turned up.
Russell 2000
The iShares Russell 2000 Index (IWM) tested its 20-day EMA last week before decisively moving above the 38.2% Fibonacci retracement resistance at $109.86.
The quarterly pivot is at $112.95 and a close back above it would be positive. The daily downtrend, line e, is now at $115.
The Russell 2000 A/D has continued to improve as it is well above its WMA and getting closer to its longer-term downtrend, line f.
The daily OBV closed above its downtrend, line g, on Friday, which is an encouraging sign. The WMA is now clearly rising, consistent with a new uptrend.
There is initial support at $109.25 and the rising 20-day EMA. There is more important support in the $107-$107.50 area.
NEXT PAGE: Sector Focus, Commodities, and Tom's Outlook
|pagebreak|Sector Focus
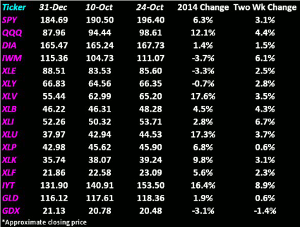
The iShares Dow Jones Transportation (IYT) accelerated to the upside last week as it is up well over 8% since the close on October 10. It is also one of the top performers for the year, up just over 16%.
Though the all time high at $156 has not yet been exceeded, the daily and weekly OBV have made new all time highs. The relative performance analysis continues to indicate that it is a market leader.
The daily starc+ band is now at $157.87 with the weekly at $159.97. There is initial support now in the $149-$150 area.
It has been an impressive two weeks for the ETFs as the Select Sector Industrials (XLI) is up 6.7% followed by a 6.1% gain in the beleaguered iShares Russell 2000 Index (IWM). It is still negative for the year but is approaching a seasonally strong period.
The Spyder Trust (SPY) is now up over 6% for the year while the PowerShares QQQ Trust (QQQ) was up 4.4% in the past two weeks and is now up 12.1% for the year.
The SPDR Dow Industrials (DIA) is back in positive territory for the year.
The Select Sector Health Care (XLV) and the Select Sector Utilities (XLU) continue to lead the charge up 17.6% and 17.3% for the year. As I pointed out in my article on the recent big money poll, the utilities are still the least favored sector as they have been for a year.
The Select Sector Technology (XLK) and the Select Sector Financials (XLF) were both up over 2% in the past two weeks with the XLK leading the way.
Interest Rates
The yield on the 10-Year T-Note closed the week higher at 2.273% as the ranges narrowed significantly last week. There is still strong resistance in the 2.40-2.50% area.
Precious Metals
In Friday’s daily column I Hope Gold Owners Followed the Plan..., I reviewed last month’s plan for both the Market Vectors Gold Miners ETF (GDX) and the SPDR Gold Trust (GLD). The update of the technical outlook covers the monthly, weekly, and daily charts.
The Week Ahead
It looks like we have formed another one of the formerly rare v-shaped bottoms as the stock market had its best week in almost three years. The positive short-term technical outlook started off last week on a positive note and this was followed by very strong buying. Chasing the averages is difficult at this time as a reasonable stop needs to be placed well below the market.
Therefore, I would continue to look for a pullback in the averages to their 20-day EMAs and some of the stocks that show the strongest bottoms basis the volume analysis should give up some of their recent gains. The decline may be brief and—as most of you know—I give recommendations during the day via my Twitter feed.
The relative performance analysis continues to favor the small- and mid-cap stocks as they enter a seasonally strong period in the next month. There were some earnings disaster in some of the most well known big-cap names and their monthly charts suggest they could even go lower.
Those who have followed the dollar cost averaging program in the Vanguard Total World Stock Index (VT) made their final investment last week. I continue to view the recent drop as a correction in the long-term uptrend, as there are no signs of a major top or an imminent recession.
Don't forget to read Tom's latest Trading Lesson, Volume Always Precedes Price.

