The wall of worry became more crowded once the sellers took over the stock market, but MoneyShow's Tom Aspray wonders if anything has really changed and thinks there are still positive signs as earnings season approaches.
The sellers took over the stock market last week as Russian threats, the EuroZone economy, Alibaba's IPO, as well as the air attacks in Syria and Iraq all shared blame for the decline. This was in sharp contrast to the euphoria of the previous week.
Many investors will be shaking their heads when they review their portfolios this weekend. Those who were waiting to buy are already having second thoughts as the wall of worry I discussed last week has become much more crowded.
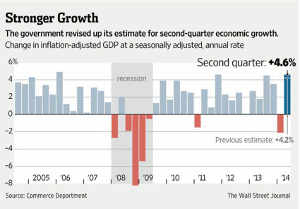
So what has changed? Friday's final reading on the economy shows that the 2nd quarter GDP grew at a 4.6% seasonally adjusted rate, the best since 2011. This should be enough to dispel the concerns over the 1st quarter's negative growth.
There were plenty of positive signs as consumer spending is rising at a 2.5% annual rate. After tax profits from corporations were also revised upward to 6.2%, quite a turnaround from the 2.9% decline in the 1st quarter.
As reported by the WSJ, "Macroeconomic Advisers predict 3.6% annual growth from July through September. If that materializes, the economy will have grown at a pace of at least 3.5% for four of the past five quarters. That hasn't happened since the late 1990s."
This bodes well for the earnings season, which officially gets underway on October 8. As I discuss in more detail in the What to Watch section, there have been some significant changes in the technical outlook. This allows for a deeper and possibly longer lasting correction. This should not deter investors from maintaining their commitment to the stock market.
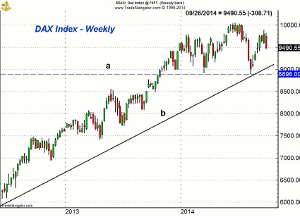
The selling last Thursday began overseas as the DAX Index reversed into negative territory just after the New York opening. The next good support is in the 9100-9300 area, line b. The weekly chart shows that the DAX is still well above the August low of 8896 (line a).
Of course, many are wondering whether Mario Draghi and the ECB are going to take more aggressive action to jump start the lagging EuroZone economies. The weakening data and low inflation rates are definitely a concern.
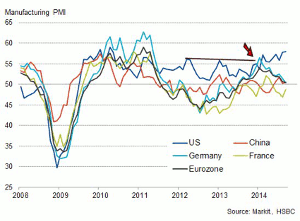
The global manufacturing PMI data shows that the US remains the strongest as I noted its upside breakout (see arrow) early in the year. Germany, France, and the EuroZone have been declining from their early 2014 peaks and are testing the important 50 level. I continue to expect that these economies will be doing much better by early 2015.
The precious metals have certainly not been a safe haven for investors as the SPDR Gold Trust (GLD) is down 7.56% over the past three months. As I detail in 3 Things Gold Owners Should Know, any holders of the metals need to be aware of my outlook for the metals.
In addition to the strong GDP report last week, the data on manufacturing was positive including the PMI Manufacturing Index and Richmond Fed Manufacturing Index. Though Existing Home Sales were weak, there an 18% jump in New Home Sales was recorded last Wednesday.
The final report on Consumer Sentiment from the University of Michigan came in at 84.6 on Friday reflecting confidence in the outlook for jobs and income.
NEXT PAGE: What to Watch
|pagebreak|The stock market will have a full slate of economic data to contend concluding with the monthly jobs report on Friday. Things get started on Monday with the Personal Income and Outlays, Pending Home Sales, and the Dallas Fed Manufacturing Survey.
Tuesday we get the S&P Case-Shiller HPI, Chicago PMI, and Consumer Confidence. The ADP Employment Report will be released Wednesday along with the PMI Manufacturing Index, Construction Spending, and the ISM Manufacturing Index.
In addition to the jobs report on Friday, we also have the ISM-Non-Manufacturing Index. If one of these reports should disappoint the stock market, it is important to remember that it takes more than one data point to change an overall positive trend.
What to Watch
My September 18 stock market analysis (Sell the Rumor and Buy the News?) was that the stock market needed to prove itself on the upside. The market finished September 19 with weak A/D numbers, which set the stage for last Monday's sharp decline.
The strong rallies last Wednesday and Friday helped to stem the bleeding but investors are still likely nervous with the recent increase in volatility. The A/D ratios were strong Friday and the ARMS Index that reached oversold levels on Thursday (see chart) will reverse to the downside Friday.
Last week's selling put the daily technical studies solidly in the sell mode even though the weekly analysis is still positive. Many are now wondering whether there is enough selling pressure to push the NYSE Composite, Spyder Trust (SPY), SPDR Dow Industrials (DIA), and PowerShares QQQ Trust (QQQ) back to the August lows.
Despite the selling early in the week, there was little change in the number of bullish investors, according to AAII, as they declined from 42.24% to 41.84% last week. A bit over 5% of the neutral camp did turn bearish as the percentage rose from 22.98% to 28.23%. These are still not readings consistent with a market bottom.
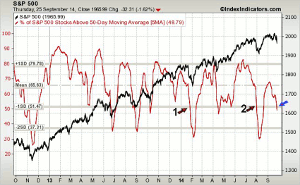
The 5-day MA of the number of S&P 500 stocks above their 50-day MAs dropped to 48.79% on Thursday as it is now one standard deviation below the mean. It looks similar to what occurred in late January (point 1) and in late July (point 2).
If we are going to see a more serious decline then we should see an oversold rally that lasts long enough to worry those on the short side.
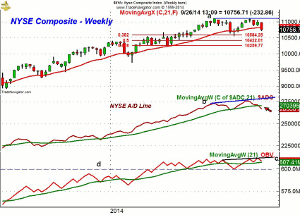
The NYSE Composite (NYA) shows that it closed the week below its 20-week EMA but should close the week above the quarterly pivot at 10,758. The 38.2% Fibonacci retracement support from the February lows is at 10,584.
The August low was 10,557 while the preliminary quarterly pivot for the 4th quarter is at 10,510. The 50% support is at 10,422.
The weekly NYSE Advance/Decline did make a new high in early September, line b, but has now dropped below its WMA. A failing rally back to its WMA over the next few weeks would be more negative.
The McClellan Oscillator (not shown) made a series of lower lows and should close the week well below -200 but above the week's lows.
The weekly OBV also made new highs early in the month and is still holding above its WMA. The daily OBV (not shown) is well below its declining WMA.
NEXT PAGE: Stocks
|pagebreak|S&P 500
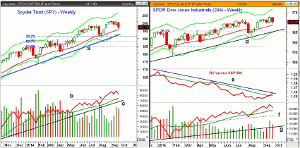
The Spyder Trust (SPY) held above Thursday's lows in Friday's session as it closed up almost 1%. The decline took price between the minor 38.2% and 50% support levels from the August lows. There is more important support in the $193-$194 area with the weekly starc- band at $192.73. The weekly uptrend, line a, is just a bit lower.
The weekly on-balance volume (OBV) did make a new high just one week ago and is still well above its rising WMA. The OBV has more important support at lines b and c.
The S&P 500 A/D (not shown) is well below its declining WMA and still shows a series of lower lows.
There is initial resistance at $197.70 with the declining 20-day EMA at $198.93.
Dow Industrials
The SPDR Dow Industrials (DIA) also closed the week above the highs as the minor 38.2% Fibonacci support was tested. The 20-week EMA is at $168.30. The major 38.2% Fibonacci support from the February low is at $165.50 along with the weekly trendline support, line d.
The weekly relative performance has just slightly overcome its downtrend, line e. The daily RS analysis suggests that the Dow is now a market leader.
The Dow Industrials A/D line is still well above the September lows as it did confirm the recent highs.
The weekly OBV has turned lower after making a new high on September 19. The OBV has further support at its rising WMA and major at the uptrend, line f.
Nasdaq 100
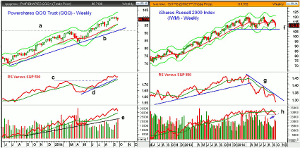
The PowerShares QQQ Trust (QQQ) looks ready to close the week just over 1% lower for the week. On the weekly chart, it does not look like much of a decline. The rising 20-week EMA is now at $95.66 with the August low at $93.88.
There is more important support in the $91-$92 area, lines a and b.
The weekly RS analysis indicates that the QQQ is still a market leader, which was reinforced by the breakout above resistance, line c, during the summer.
The weekly OBV did make a high just a week ago from last Friday but turned lower last week as the volume did increase last week. It is well above its rising WMA.
The daily OBV (not shown) is below its WMA and is in a short-term downtrend.
The 20-day EMA is now at $98.94 with further resistance in the $99.65-$100 area.
The Nasdaq 100 A/D (not shown) did not make a new high with prices on Friday September 19. It formed lower lows last week and is clearly in a short-term downtrend.
Russell 2000
The iShares Russell 2000 Index (IWM) dropped down last week to test the August low at $109.89 but did close above the lows. There is more important support in the $107-$107.44 area, line f.
In Friday's column The Small-Cap Conundrum, I compared the Russell 2000 and the S&P 600 while also reviewing the midcap S&P 400.
The daily A/D (not shown) formed lower lows last week and has already dropped below the August low. This is a more serious warning if it does not turnaround.
The weekly OBV is now slightly below its WMA as volume has picked up over the past two weeks. If we get another week of heavy selling, the OBV will look even more negative.
The weekly relative performance declined even further last week as the downtrend in the RS line identified this as a market lagging sector since the spring.
There is initial resistance now in the $116-$116.53 area.
NEXT PAGE: Sector Focus, Commodities, and Tom's Outlook
|pagebreak|Sector Focus
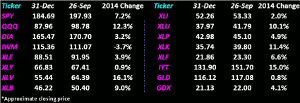
The iShares Dow Jones Transportation (IYT) gave up over 2% last week but is still one of the top performers for the year. The decline held well above the monthly pivot at $148.44. For October, the preliminary monthly pivot will be at $152.47.
The daily and weekly studies do not show any signs yet of a significant top. The relative performance analysis does indicate that the Transports are still a market leader.
The Spyder Trust (SPY) and the PowerShares QQQ Trust (QQQ) both lost over 1% for the week, which-given the market's tone-was not too bad.
The SPDR Dow Industrials (DIA) is still well in positive territory and the RS analysis for the Dow stocks is encouraging. The iShares Russell 2000 Index (IWM) is down 3.8%, so far, in 2014.
The Select Sector Health Care (XLV) held up quite well last week as it is still up over 16%. The biotechnology stocks were strong in Friday's session.
The Select Sector Utilities (XLU) is barely holding its double digit gains as is the Select Sector Technology (XLK).
The Select Sector Financials (XLF) were also hit with selling and the financial ETFs have held well above more important support.
Crude Oil
The November crude oil contract held the monthly projected pivot support at $89.39 and closed the week with nice gains. The daily studies suggest a short-term bottom is in place while the weekly analysis is still negative.
Precious Metals
The Market Vectors Gold Miners ETF (GDX) and SPDR Gold Trust (GLD) closed the week flat but the technical outlook I discussed last Thursday still suggests a rally should be sold.
The Week Ahead
Last week's early trading clearly turned the focus on the downside, and despite Friday's nice rally, there are no signs yet that the correction is over. This suggests we may see another week or more of choppy to lower trading before we start a sustainable new uptrend.
On a seasonal basis, the market often sees a rally after the first week of October but then drifts sideways to lower trading for much of the month. I continue to think that this correction is a buying opportunity.
Some of my recent recommendations did hit my suggested buy levels but I will be watching all positions closely to see if the stops need to be adjusted. I will continue to look for new opportunities in stocks that are close to good support and show positive volume and relative performance analysis.
Those not in the stock market should have added a second dollar cost averaging position in the Vanguard Total World Stock Index (VT) last Wednesday. To complete the program, you should make three more equal dollar investments every two weeks that will get you completely invested by early November.
Don't forget to read Tom's latest Trading Lesson, Finding the Sweet Spot in the Financial Sector.
For more on the markets, you might enjoy some of Tom's recent articles:

