Despite the strong stock market performance in August, many are still focused on the historically poor stock market performance in September, so MoneyShow's Tom Aspray takes to the charts to suggest when, where, and how much to invest this month.
The US stock market churned at new all time highs last week as the market had to endure a heavy slate of economic data as well as the new efforts to lower global tensions.
Despite the surprising strong stock market in August, many are still focused on the historically poor stock market performance in September. As I pointed out two weeks ago, I continue to think that a pullback in September will present a buying opportunity.
Even though the stock market has been strong and the economy seems to be getting even better, many investors are still on the sidelines. Some have stayed out because of the dot.com bubble while others are still trying to recover from the 2008 financial crisis.
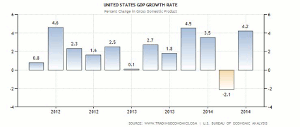
All year the mainstream financial media has also given the investor plenty of reasons not to invest in stocks. During the spring and early summer, the argument was that the economy was not strong enough to support the current high stocks prices. The dismal 1st quarter GDP supported this view.
There were many reasons early in the year to believe that the economy was actually stronger than expected, as I noted in the April 14 column A Spring Breakout for the Economy? Of course, the GDP has turned around sharply in the 2nd quarter as it was revised in August to 4.2%.
The current reason not to buy stocks is the fear that the economy is too strong, as noted by Friday's WSJ headline Hot Jobs Market Could Singe Stock Bulls. The concern was that a strong jobs report-along with the other bullish economic data-would force the Fed to raise rates earlier than expected. As it turned out, the jobs report came out weaker than forecast but expect to hear this argument again. Though the market is likely to react badly at first to the Fed raising rates, I think gradually rising rates will not be negative for stocks.
The bond market has had quite a year as, according to Barclays, US investment grade corporate bonds have gained 6.89%. Record numbers of bonds are still being sold as-in the three days through last Thursday-a record of $39.5 billion of bonds were sold by companies like Bank of New York (BK) and Hondo Motor Co. LTD (HMC).
Though I have been wrong on the bond market, so far, in 2014, this still seems like a rubber band that is becoming stretched too far and the snap back could be vicious. This should be a concern, especially for those in closed end bond funds where the principle is not guaranteed. Though I can't recommend bonds at current levels, I have been advising that bond holders should shorten their maturities.
The strong technical readings continue to favor investing in stocks, especially with yields so low, but given the market's current lofty levels, investors are likely wondering how much they should invest and when they should buy.
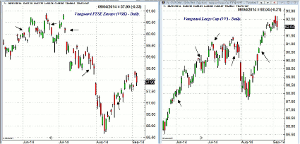
At the end of May, I suggested A Portfolio That Won't Ruin Your Summer that recommended a 30% allocation in stocks using a dollar cost averaging strategy. I recommended 10% in each of three large, low cost Vanguard funds; Vanguard FTSE Europe (VGK), Vanguard FTSE Pacific (VPL), and Vanguard Large Cap ETF (VV).
The plan was to make five equal investments in each of the three ETFs starting on June 2, with subsequent equal dollar investments made on June 23, July 7, July 28, and August 18. Therefore, you should now be completely invested.
The dates of the five investments are indicated on the charts by arrows. Up through last Thursday's close, the Vanguard FTSE Europe (VGK) is down 1.5% while the Vanguard Large Cap ETF (VV) is up 2.3%. The Vanguard FTSE Pacific (VPL) is up 1.3%.
This method does require patience as last August I recommended a similar approach (A Contrary Bet for 2014?) for the Vanguard FTSE Emerging Markets ETF (VWO). In late 2013 and early 2014, it had a negative return but is now up well over 25%.
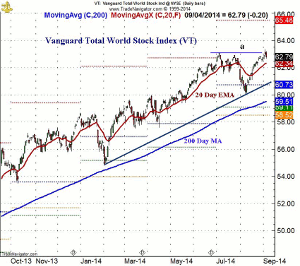
I recommended a similar approach for either a S&P 500-tracking ETF or fund on January 10. Those who are still not invested should decide how much they are comfortable investing (20% to 60%) and use a dollar cost averaging approach in the Vanguard Total World Stock Index (VT). This is less volatile than the other three and gives one global exposure.
It has a current yield of 2.26% with an expense ratio of 0.18%. It has holdings in 6,290 stocks with the largest holding of 1.34% in Apple, Inc. (AAPL). The long-term chart shows it has just recently moved above the early July highs. It is up over 7% YTD.
It is just 0.7% above its 20-day EMA (see this week's trading lesson) and is 5.2% above its 200-day MA. The chart shows that the long-term uptrend, line b, and the quarterly pivot are in the $60.73 area. This should be major support.
NEXT PAGE: What to Watch
|pagebreak|I would make your first investment once VT drops below $62.15 or by September 26. After your initial investment, make four more equal dollar investments every two weeks. This should have you completely invested by the end of November and well positioned for the stock market's strongest months.
The European markets have rebounded sharply and I think they will do much better in the next year as their economy is likely six-to-eight months behind the US. The euro plunged on the ECB rate cut last Thursday and many are predicting that it will now move even lower.
It is never a good idea to invest with the crowd and commodity expert John Person told me "the short position in the euro by not only the small speculators but also the hedge funds is near record levels. Also the seasonal analysis shows that the euro typically bottoms out on September 9 suggesting those on the short side could be squeezed."
A lower euro will help their exports and hopefully they will also see a pickup in inflation. Apparently, the rate cut by the ECB caught some by surprise though I thought a careful reading of Mario Draghi's prior comments made me confident they would lower rates. More may be needed before their recovery is assured.
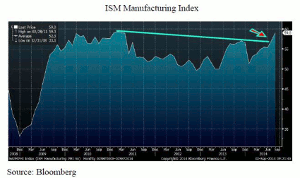
The economic data last week exceeded all bullish expectations. The ISM Manufacturing Index jumped to 59 and clearly has broken through resistance at line a. This is the highest reading since April 2011. Orders were strong and this reading was consistent with the Markit PMI Manufacturing Index that rose to 57.9 from July's 55.8.
Just before the Labor Day holiday, the Consumer Confidence was reported at 90.9, which is the highest reading of the recovery. The Consumer Sentiment from the University of Michigan was not as strong. Other positive signs last week came from much higher than expected light vehicle sales and a strong gain in the ISM's Non-Manufacturing Index.
There is a light calendar this week as the market's focus will likely be on Tuesday's announcement from Apple, Inc. (AAPL). In addition, on Friday we get Retail Sales, Import and Export Prices, Consumer Sentiment, and Business Inventories.
What to Watch
The stock market hit intra-day highs several times last week but the S&P 500 was not able to make a new closing high until Friday. Despite a weaker than expected jobs report the major averages accelerated to the upside late in the day. This could complete the recent trading range and signal that the market is ready to start a new push to the upside. I had been looking for a correction that could take the S&P 500 back to the 1975-to-1960 area.
The A/D analysis is still clearly positive but the daily/weekly OBV readings continue to be mixed as the volume in the index tracking ETFs has remained low but the cash volume has been stronger. The monthly OBV analysis on both the Spyder Trust (SPY) and the PowerShares QQQ Trust (QQQ) did confirm last month’s highs.
Surprisingly, there are still a number of stocks that have not been participating in the recent market’s strength. This makes stock selection and the entry level even more important. In last week’s trading lesson Avoiding High Risk Entries I introduced a different approach to gauging the risk of your entry point.
There are a number of large-cap companies which are in the S&P 100 that are now closer to major support. As I noted last week, there is one that I recommend and another that I am watching closely.
The too high bullish individual investor sentiment did decline but is still fairly high at 44.67%. It would likely take a sharp one-to-two day drop to push this reading to more comfortable levels.
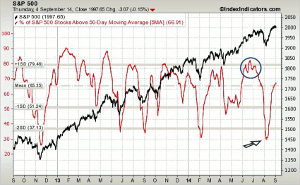
As I noted in early August, the five-day MA of the % of S&P 500 stocks above their 50-day MAs completed a bottom after dropping to 29.6% (a low risk level). The MA is now up to 66.91%, which is just barely above the mean at 65.35%.
The top formation in July (see circle) had me looking for a correction that finally came in late July and early August. Once the % gets back into the 75-80% area then buyers will need to be more selective.
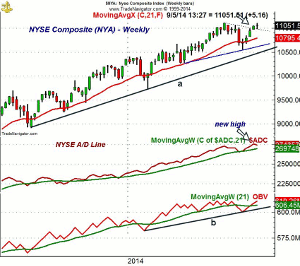
The weekly chart of the NYSE Composite (NYA) shows that it closed above its short-term downtrend (see arrow) at the end of August. Still, the early July high at 11,105 has not yet been overcome. There is monthly pivot resistance now at 11,214. The NYSE looks ready to form a doji this week.
The rising 20-day EMA is now at 10,960 with the monthly pivot at 10,886. The quarterly pivot is at 10,755 with additional support at 10,680.
The weekly NYSE Advance/Decline made a new high just before Labor Day as it tested the rising WMA on the early August drop. The daily A/D line (not shown) has also made a new high.
The McClellan Oscillator (not shown) has been diverging from prices since the middle of August and looks ready to close the week below the zero line.
The weekly OBV is well above its WMA and could make a new high this week once the final numbers are in.
NEXT PAGE: Stocks
|pagebreak|S&P 500
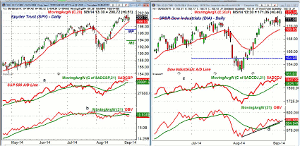
The Spyder Trust (SPY) dropped back to its 20-day EMA on Friday before closing strong. Once above last week’s high at $201.58 the daily starc+ band is at $203.27. For September, the monthly projected pivot resistance is at $207.63.
On a short-term basis, a close below $199 could signal a drop back to the monthly pivot at $197.36. There is further support in the $195.50-$196 area.
The S&P 500 A/D broke out to new highs on August 20 as the previous high, line a, was overcome. It made further new highs in the past week. It is well above the rising WMA.
The on-balance volume (OBV) has been lagging the price action as it is currently below its WMA. It came close to making new highs in late August, line b. The weekly OBV has made convincing new highs as has the monthly OBV (see chart).
Dow Industrials
The SPDR Dow Industrials (DIA) made a marginal new closing high on Friday. The daily starc+ band is now at $173.04 with the monthly projected pivot resistance at $176.87.
The Dow Industrials A/D line has made a series of new highs over the past two weeks as the July highs (line c) were finally overcome. The A/D line is well above its clearly rising WMA.
The daily OBV has turned up from support but is still well below the July highs. The weekly OBV will close the week at another new high but the relative performance does not indicate that the Dow Industrials is leading the S&P 500.
Nasdaq 100
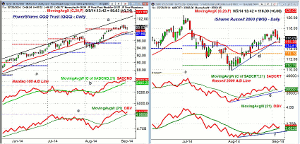
The PowerShares QQQ Trust (QQQ) made a new closing high last Tuesday but then drifted lower until Friday’s late rebound. It is still well above the 20-day EMA at $98.51 with the monthly pivot at $97.86. There is more important support in the $96.50 area.
The daily starc+ band is at $101.27 with the upper boundary of the trading channel in the $102.50 area. The monthly projected pivot resistance is at $103.88.
The Nasdaq 100 A/D line broke out to the upside on August 19 and made further new highs last week. It has initial support at the rising WMA with further at the July highs, line b.
The daily on-balance volume (OBV) pulled back to support, at line c, last week before turning higher. It did make a new high last Tuesday.
Russell 2000
The iShares Russell 2000 Index (IWM) dropped below its 20-day EMA and the daily uptrend, line d, last Friday. The close was above the day’s lows with the quarterly pivot at $114.61. A close below the $113 level would be more negative.
The daily studies were the weakest last week as the Russell 2000 A/D line has dropped just barely below its still rising WMA. The A/D line has further support at the uptrend, line e.
The daily OBV does appear to have held above its WMA last week. It had formed a shallow uptrend, line f, from the lows and this is now a more critical level of support.
There is initial resistance now at $116.50-$117.50 with more important in the $119-$120 area.
NEXT PAGE: Sector Focus, Commodities, and Tom's Outlook
|pagebreak|Sector Focus
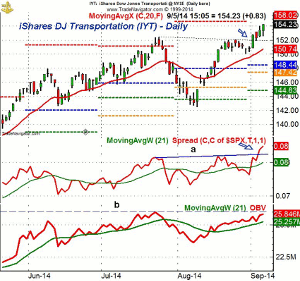
The iShares Dow Jones Transportation (IYT) has been leading the market higher as it closed above key resistance, line a, last Tuesday. This is bullish action for the overall market as it has been a leader for most of the bull market.
The daily relative performance has confirmed the upside breakout as it has also moved above its resistance (line a). This confirms that it is a market leading sector.
The OBV has not yet confirmed the price action as it is still below the July highs, line b. The weekly OBV (not shown) has made a new high.
The rising 20-day EMA is now at $150.73 with the monthly pivot at $148.44.
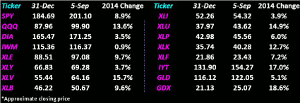
The Spyder Trust (SPY) and the PowerShares QQQ Trust (QQQ) have added to their gains over the past two weeks with the QQQ now up over 13% while the SPY is closing in on a 9% gain for the year.
The SPDR Dow Industrials (DIA) is now up 3.4% while the iShares Russell 2000 Index (IWM) is now positive for the year.
The Select Sector Health Care (XLV) has made significant new highs as it is now up 15.5% for the year. This is closely followed by the Select Sector Utilities (XLU), which is up 14.7%.
The Select Sector Financials (XLF) staged an upside breakout two weeks ago and has continued to move nicely higher. It is now up 12.6% for the year and is clearly a new market leader.
The Select SPDR Energy (XLE), the Select Sector Industrials (XLI), and the Select Sector Consumer Staples (XLP) are the three lagging sectors I discussed last week.
Interest Rates
The yield on the 10-Year Treasury Note closed higher last week and is well above the late August low of 2.33%.
Crude Oil
The November crude oil contract was down over $2.50 per barrel last week and the weekly OBV looks ready to close below more important support.
Precious Metals
The Market Vectors Gold Miners ETF (GDX) and SPDR Gold Trust (GLD) still appear to be tracing out continuation patterns that favor an eventual break to the downside.
The Week Ahead
Every since the A/D line gave the all clear signal just over two weeks ago, the market has been very strong as there has been little in the way of a pullback. This has made it harder to be an aggressive buyer though we continue to look for new buying opportunities.
As I expected last time, the ECB did cut rates and the Eurozone markets have added to their gains, which now makes a test of the early August lows unlikely.
The new weekly and daily highs in the NYSE A/D lines do clearly favor the bullish case as they did in September 2010. It is possible those fund managers who have been on the sidelines will have to do some heavier buying before the end of the quarter.
I been unable to find a good entry level to add to the position in the PowerShares QQQ Trust (QQQ) as a deeper setback is required.
For those on the sidelines, you should consider even a small dollar cost averaging program in the next few weeks.
Don't forget to read Tom's latest Trading Lesson, Avoiding High Risk Entries.

