The stock market often has a rough time of it during the summer, so MoneyShow's Tom Aspray turns to the Fear & Greed Index to see if the current level of fear is consistent with a bottom as we head into another week full of economic data.
It has been an ugly couple of weeks for the stock market and, while the summer months are often difficult, the ballooning number of global hot spots has put even more pressure on stocks. The negative signals from the technical indicators (The "Real Reason" for the Market's Plunge) are still in force as the major averages reach stronger support.
Then, late last Thursday, the markets had to deal with the news that US forces would again be seeing limited action in Iraq. It is not quite four months since the April lows when many investors feared that the economy and company earnings would not be good enough to support the high stock prices.
Therefore, the sharp market rally that began in mid-May caught most by surprise and the market stayed technically strong until early July. The latest earnings season has beat analysts' estimates and the recent strong US economic data has supported the contention that the very weak 1st quarter GDP data was an aberration.
The selling was relentless last week, which was what I feared on July 11 when I asked investors if they Should You Reconsider Buying the Dip? At the time, I also noted that uniformly high bullish sentiment was not being supported by the technical readings.
So, has the fear level reached a level that is consistent with a market bottom? Though I rarely read other analysts' opinions, I did come across a recent post by frequent MoneyShow speaker Nick Vardy.
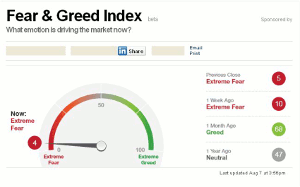
Nick is a very sharp guy who I have always enjoyed speaking with at the conferences and in this article he discussed a sentiment indicator that I was not familiar with, the CNN's Fear & Greed Index. The Index ranges from 0 to 100 and in Nick's article the index was at 5 but has declined this week to 4.
This very low level is associated with Extreme Fear and it has dropped sharply from the July 7 reading of 68 which was in the Greed zone. A year ago, the Index was neutral at 47 as the S&P 500 closed at 1691. Despite the market's recent decline, this is still 11.4% below current levels.
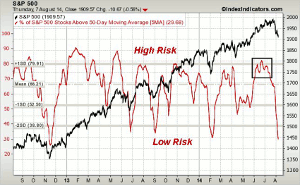
The index is composed of seven indicators and does not include some of the sentiment tools like AAII's individual investor poll or Investors Intelligence. It also does not include one of my favorite measures of market risk, the number of S&P 500 stocks above their 50-day MAs, which looked quite toppy in early July (see chart).
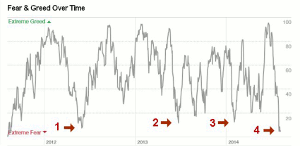
Without the data, one can only assess its value in broad terms but I have highlighted a few extremes in the Fear & Greed Index from their long-term chart. The chart begins in the latter part of 2011. The Index was then at very low levels which likely corresponded to the October 2011 low.
Another low in 2012, point 1, probably came in June 2012 as the low was accompanied by extremely negative sentiment and bullish technical formations. The fear was also quite high in the summer of 2013 which I believe was just caused by a shallow six week pullback.
In early February 2014, the Index also dropped below 20 (point 3) and the ARMs Index confirmed it with an extreme oversold reading. Clearly, the current reading means that even though the Index can't go much lower, it could hover in fear territory for some time before a market bottom is completed (see What to Watch section).
Maximum bearish sentiment does not always coincide with stock market lows as it often occurs first. For example, in the summer of 2011, the maximum fear was likely in early August as US debt was downgraded. The market did not make its final low until October.
The high level of the Fear & Greed Index is consistent with the recent fund flows. Another $7.1 billion came out of junk bond funds in the last week. It was the largest outflow since 1992 when they started keeping records.
It was another rough week for junk bonds as, according to Reuters, they had a "negative total return of 1.42% in the week ended August 1." Investors also fled stocks as $16.4 billion moved out of US stock funds and ETFs.
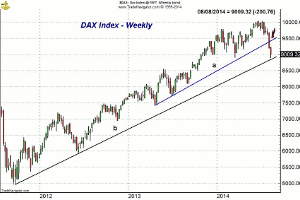
The new sanctions by Russia have added to the selling pressure in the EuroZone countries whose stock markets peaked out several weeks ahead of the US. For example, the DAX index made its high on June 20 and subsequently triggered a low close doji sell signal.
NEXT PAGE: What to Watch
|pagebreak|The weekly chart shows that the DAX has now violated the uptrend from the April 2013 lows, line a. The longer-term support, line b, from the late 2011 lows, now stands at 8800. A decline to the 8500 area is possible before the correction is over.
As I said last time, it is "likely that the DAX will bottom out ahead of the US markets" but there are still no signs yet that it has bottomed. The DAX was lower again on Friday but did close above the lows. The DAX is down 10.3% from its June high which often times is enough of a correction in a major uptrend.
Even though the economic data in the EuroZone has seen some deterioration, the ECB did not act on rates last week. However, I would not be surprised to see them lower rates, possibly even before their next scheduled meeting on September 4.
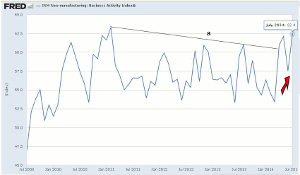
The economic calendar was light last week but, on Tuesday, Factory Orders were up 1.1%, well above analyst forecasts of a 0.6% increase. Even more positive was the sharp increase in the ISM Non-Manufacturing Index as it was up 4.9 points from the June reading.
This was the best reading in three years and has reconfirmed the move through resistance (line a) that occurred earlier in the year. The higher lows and higher highs are a clear indication of a new uptrend, which is another positive sign for the economy.
The data this week starts with the Retail Sales and Business Inventory data on Wednesday. In addition to jobless claims on Thursday, we also get Import and Export Prices. They are followed on Friday by the PPI, Empire State Manufacturing Survey, Industrial Production, as well as the preliminary reading on Consumer Sentiment for August from the University of Michigan.
What to Watch
In last week's column, I was looking for an oversold rally last week but Monday's meager bounce did not qualify. The further waves of selling on Tuesday and Thursday were enough to convince most not to buy the dip.
Last Thursday, the short-term technical readings did favor a much stronger rebound and I detailed what I expected in Get Ready for a Rally. The market responded with a vengeance on Friday as the S&P 500 was up over 22 points. The rally was much more impressive technically and I would expect to see further gains early this week.
Surprisingly, there was little change in the bullish percentage of individual investors last week, though the number of bears increased from just over 31% to 38.2% last week. In April of 2013, the bearish % jumped to over 50%, which was also the reading in August 2011.
According to option expert Larry McMillan, all of the put-call ratios that he follows are rising and therefore still negative. This suggests that the bearish sentiment has not yet peaked.
There are some encouraging signs as the five-day MA of the % of S&P 500 stocks above their 50-day MAs topped out in early July after reaching a high risk level above 80%. It has plummeted this week and-as of Thursday's close-had dropped to 29.6%. This is just slightly below the February lows. It was even lower in November of 2012.
An upturn in the MA needs to be accompanied by positive signals from the A/D indicators to signal that the correction is actually over.
NEXT PAGE: Stocks
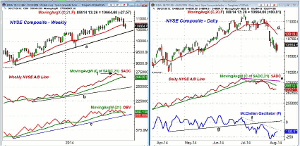
|pagebreak|The weekly chart of the NYSE Composite (NYA) shows that it closed below the quarterly pivot at 10,758 the previous week. It did close the week lower and just below its 20-week EMA at 10,701.2. The uptrend from the 2013 low is now in the 10,400-500 area. A weekly low close doji sell signal was also triggered two week's ago.
The weekly NYSE Advanced/Decline did make a new high with prices in late June (point 1). This is a positive sign for the stock market's major trend. The A/D line is on the verge of dropping below its WMA this week for the first time since late 2013.
The weekly OBV has dropped further below its WMA and is now reaching its longer-term uptrend, line c. The OBV did form a slight negative divergence at the recent highs.
The daily chart shows initial resistance at 10,750 with the declining 20-day EMA at 10,860. There is more important resistance in the 10,880 area, line d.
The daily A/D line is trying to turn higher but is still well below its declining WMA. There is more important resistance for the A/D line at the bearish divergence resistance (line e). This resistance level will need to be overcome to confirm that the market's correction is over.
The McClellan Oscillator bottomed at -278 on August 1 and has rallied back to the -158 level. The downtrend, line f, is in the -100 area. The oscillator could rally back to the zero line and even above it on an oversold rally.
S&P 500
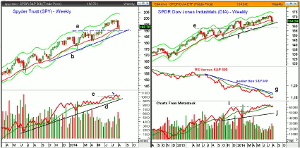
The Spyder Trust (SPY) closed the week higher with Friday's strong action. It did close back above the 20-week EMA and the quarterly pivot at $191.24. The SPY came very close to the weekly chart support from the April highs, line a.
The daily starc- band was tested last week with the weekly at $188.63. As I noted Thursday, the 38.2% Fibonacci retracement support from the February lows is at $188.23.
There is initial resistance at $193.60-$194.30 with the declining 20-day EMA now at $194.78. The daily starc+ band is at $195.93 with stronger resistance in the $196.50 area.
The weekly OBV did make a new high three weeks ago and is still holding above its rising WMA. The OBV has long-term support at line d.
Dow Industrials
The SPDR Dow Industrials (DIA) dropped to a low last week of $163.13 and tested the weekly uptrend, line f. The low was not far above the weekly starc- band at $162.59. A close above last Monday's high at $165.51 would be a short-term positive with the 20-day EMA $166.93.
There is much stronger support in the $160 area and then at $157, line e.
The relative performance tried to turn up last week but is still in a well established downtrend. There is strong resistance at the downtrend, line g, and the declining WMA.
With the higher close, the weekly OBV looks ready to close back above its flattening WMA.
The Dow Industrials A/D line (not shown) continues to act very weak as it made a series of lower lows last week and did confirm the price lows.
Nasdaq 100
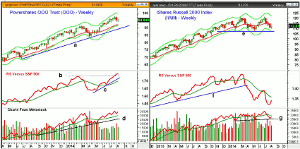
On the weekly chart of the PowerShares QQQ Trust (QQQ), the recent correction does not look like much as it has held above the band of support in the $93.60-$94.20 area. The monthly pivot is at $92.82.
The monthly projected pivot support is at $91.49 with the weekly starc- band now at $90.98. The daily starc- band was exceeded on August 1.
The Nasdaq 100 A/D line did form a negative divergence at the July 24 high (see Thursday's chart) and is holding above the key A/D line support.
The relative performance broke out to new highs last month as the resistance, at line b, was overcome. The RS line is holding well above its uptrend (line c) and the rising WMA.
The weekly OBV made a new high with prices in July and is still acting strong. It shows a pattern of higher lows and higher highs while staying well above its rising WMA.
Russell 2000
The iShares Russell 2000 Index (IWM) also closed the week higher as the quarterly projected pivot support at $110.78 was tested. On the weekly chart, the major support is evident in the $106.58-$107 area, line e.
The weekly relative performance has turned up but is still in a well established downtrend. The WMA is still declining sharply.
The weekly OBV has turned up from important support but it needs to move back above its WMA to stabilize the weekly chart.
The daily Russell 2000 A/D line (not shown) did make new lows with prices but improved as the week progressed.
The declining 20-day EMA is at $113.08 with the quarterly pivot at $114.61.
NEXT PAGE: Sector Focus, Commodities, and Tom's Outlook
|pagebreak|Sector Focus
The iShares Dow Jones Transportation (IYT) was one of the few ETFs that did not close the week higher as it has been hit hard over the past two weeks. It has still not had a weekly close below quarterly pivot at $142.15.
The weekly OBV is now just barely below its WMA and the daily studies remain negative.
The monthly pivot is at $147.98 with additional resistance in the $150 area.
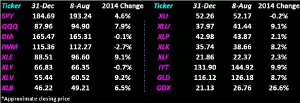
Most of the ETFs are showing slightly better performance from last week as the Spyder Trust (SPY) is now up 4.6%. The PowerShares QQQ Trust (QQQ) has also improved slightly but the SPDR Dow Industrials (DIA) is still slightly negative for the year.
The Select SPDR Energy (XLE)-like most of the sector ETFs-did close the week higher but the Select Sector Utilities (XLU) and Select Sector Technology (XLK) closed lower.
Basis the chart formation, one could make a case that some of the sector ETFs are just completing normal corrections. The daily technical studies do not yet indicate that the selling is over but I will be watching them closely.
The Select SPDR Consumer Discretionary (XLY) is starting to look the best and we are still holding onto our long positions.
Crude Oil
The October crude oil contract stabilized last week and formed a doji. A close back above $98.67 this Friday would trigger a weekly high close doji buy signal.
Precious Metals
The Market Vectors Gold Miners ETF (GDX) has stayed in a fairly narrow range over the past several weeks and may be ready to breakout of its trading range. The SPDR Gold Trust (GLD) has had a deeper correction but is still holding well above the quarterly projected pivot support at $122.22.
The Week Ahead
Last week I thought that we could see a drop in the Spyder Trust (SPY) to the $188-$190 area but the low was just $190.55. The market internals were quite strong on Friday as the A/D ratios were almost 3-to-1 positive. It would take a couple of consecutive days with similar strength to suggest that the correction was over.
For now, I do not think this is the case but expect a rebound that will go a bit higher and last longer than most expect. The SPY could move back to the $196.50-$197 area. It could last three-to-five days and should set the stage for another push to the downside where new bottoming signals could be generated.
I took another look at some of the most vulnerable Dow stocks as well as some of IBD Top 50 stocks. If you have some stocks with nice gains that start to lag the market, I would continue to suggest that you take some profits.
No change for those who are in the process of a dollar-cost-averaging plan as I would definitely stick with your plan. If you have not started one yet, it is still not too late to start.
For stock traders, we took a quick profit on the inverse ETF position and sidestepped Friday's sharp rally. Depending on how the rally develops, I may look at another inverse ETF on the rally.
Also, I will be closely monitoring my weekly volume scans as we could see some stocks in the discretionary sector bottom ahead of the market.
Don't forget to read Tom's latest Trading Lesson, Three Reasons to Sell.

