Last week’s disappointing GDP report may have given investors another reason not to buy stocks but MoneyShow’s Tom Aspray thinks that there are two traits that will help investors make money in today’s tough markets.
Even though June is historically a flat month, as of Thursday’s close, the Spyder Trust (SPY) is up 1.9%. Since 1950, stocks have been higher 32 years and down 32 years with an average loss of -0.10.
July has been a bit better since 1950 with an average gain of 0.86%. Of course, any historical pattern or data should not be acted upon without other confirming data. The Spyder Trust (SPY) is up just over 3% since the last day of April and has gained more in June, so those who sold either at the start or at the end of May have missed some opportunities.
One of the most important traits that successful investors must have is patience. With today’s 24-hour news cycle, this means not reacting to any one piece of news, whether it is political, economic or just the opinion of a hedge fund manager or analyst.
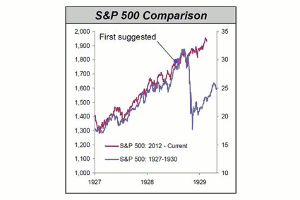
Just last month, the comments from a hedge fund manager apparently triggered a 170 point decline in the Dow Industrials. Late last year, a chart comparing today’s market to 1929 also received considerable attention. Both may have stopped some investors from buying stocks. As it turned out, the 1929 chart got the most attention just after the stock market completed an important low in early February.
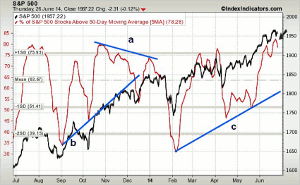
The WSJ updated the chart last week (see above), which confirmed the view of many technicians that the comparison was flawed. Of course, basing your investment strategy on one chart or data point is a dangerous approach.
There have been a number of panic declines since the start of the bull market. Even though some have lasted longer than expected, all presented good buying opportunities both for the overall market as well as individual sectors. As I discussed recently, at the early February lows, the Select Sector Energy (XLE) was down 7.6% but it is now up 14% YTD.
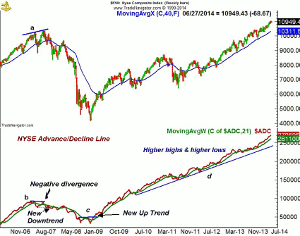
I think any news or economic report needs to be viewed within stock market’s technical outlook. This long-term chart of the NYSE Composite covers both the current bull market as well as the preceding bear market.
At the October 2007 highs, the NYSE made higher highs (line a) while the NYSE Advance/Decline was forming lower highs, line b. This negative divergence was consistent with a major top. The divergence was confirmed in early 2008 as the A/D started a new downtrend. The daily A/D line had been diverging from prices since July 2007 (see chart).
Since this was now a bear market, the March-May rally that was spurred by some better economic news should have not changed your strategy. As the rally was peaking in late May and early June, many advisors had turned bullish and had concluded the bull market was still alive. Once again following the crowd was not a good idea. A technical review of the market in June 2008 revealed that it had all the characteristics of a bear market rally.
The A/D line continued to make new lows until March 2009 when it started to turn higher. There were other signs such as the New Hi/New Low analysis that also suggested the market was bottoming out. In May, the NYSE A/D line began a new uptrend as it moved above the resistance at line c.
Since then, the A/D has formed a long-term pattern of higher highs and higher lows. There have been a number of declines back to the 21-week WMA but they have been followed by further new highs. The A/D line has been well above its major uptrend (line d) for two and a half years.
In the current technical environment, signs of economic weakness, political gridlock, or global conflict should not alter your investment strategy. They may cause you to be stopped out of some position, but if your entry level was well researched the damage to your portfolio should be minimal. These declines often result in extreme levels of bearish sentiment and ultimately create low risk buying opportunities.
In addition to being patient, investors and traders both should not be stubborn or completely committed to any one position. This means avoiding all absolutes like never or always when it comes to your investments. Many probably thought the biotech stocks could never drop that much early this year, and I too was surprised.
Taking some profits as the market moves in your favor—as well as determining high and low risk market environments—will help you weather most storms, as will protective stops. Even if you turn cautious too early there will always be more opportunities, but that requires that you still have capital to invest.
NEXT PAGE: What to Watch
|pagebreak|The stock market averages are quite extended at current levels, and with 83% of the S&P 500 stocks recently above their 50-day MAs, one has to be very selective in buying stocks at current levels. It is important for all investors to Pick Your Portfolio Strategy, which includes how much you will have in the stock market and what type of risk management approach you will take.
The much weaker than expected GDP numbers last week apparently spooked some investors and last Thursday’s decline was attributed to institutional selling, which could have been the result of mutual fund liquidations. I continue to believe that the second quarter economic data will be equally surprising in terms of its strength.
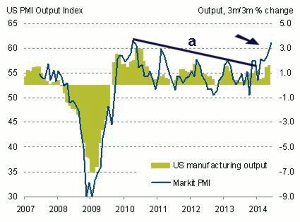
This is supported by the data of the past few months as the economy continued to get stronger in June. The Markit Flash Purchasing Mangers Index (PMI) has now turned sharply higher. I have added my own downtrend, line a, which was broken earlier in the year. This indicator and others have improved sharply and do bode well for further economic improvement in the summer.
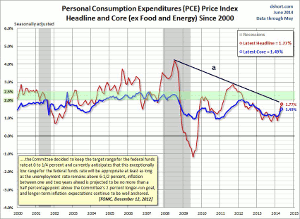
Also last week, the Fed’s favorite inflation gauge, the price index for personal consumption expenditures (PCE) came in at a surprising 1.77% in May. The chart shows that the five year downtrend (line a) is now being tested. If the PCE rises further—and the economy continues to expand—rates may rise sooner than most expect.
I pointed out in February’s Should Investors Hope for Inflation? that since 1972, we have seen an environment of low and rising inflation seven times, which has led to a 20% gain for stocks. This was also a good period for commodities, which were up 17%. Therefore, I continue to think that stock investors should welcome a gradual increase in the inflation rate over the next few years.
Even though we have a holiday shortened week, there is plenty of data starting with the Chicago PMI, Dallas Fed Manufacturing Survey, and Pending Home Sales Index on Monday. On Tuesday, we get the PMI Manufacturing Index, the ISM Manufacturing Index, and Global Manufacturing PMI.
Because of the shortened week, the monthly jobs report comes out on Thursday, which is preceded on Wednesday by the ADP Employment Report. Janet Yellen is also speaking at the IMF. Also on Thursday we get jobless claims, the ISM Non-Manufacturing Index, and International Trade.
Stocks treaded water late in the week, they rallied late Friday. It has been a pretty good, but choppy month for the stock market. The latest push to the upside caught many by surprise, reinforcing the CNBC refrain of the most hated stock market rally.
The continued skepticism and arguments over whether the market is overvalued or not is a positive for the stock market. That does not mean we can't see a further correction over the near term but it does increase the odds that it may not last long.
We did get the strong close above the June 9 high that I mentioned last time, which was needed to confirm that the correction was over. The high at 1968.16 was just above the resistance at 1966.70 that I had targeted. The quarterly projected pivot resistance at 1977.48 was not reached and for the third quarter, it tentatively stands at 2066.
I did recommend several sector ETF last week as they are on the verge of becoming market leaders and we should know more this week. In 3 Bottoming Stocks in a Strong Market I found three stocks which had turned up in my weekly scan and were not far above support.
The rally late in the week may have been a result of buying by the hedge fund and money managers as they try to avoid another bad quarter. They had bet wrong on bonds in the first quarter and that is why it is tough to justify buying them or following them.
The individual investor was a bit more positive last week at 37.2% but still well below the June 12 reading of 44.7%. Though a couple bearish analysts switched back to the bull camp last week, I do not hear many that are looking for sharply higher prices from here. Not sure this is a contrary opinion play as discussed in Why Following the Crowd Can Be a Bad Idea but the powerful action of the weekly NYSE A/D line does not rule it out.
The five-day MA of the % of S&P 500 stocks above their 50-day MAs peaked in the 83% area last week and has now turned lower (see arrow). The mean is at 63% which is quite a ways below current levels.
The uptrend, line c, is now in the 57% area. The % of stocks has made higher highs unlike late last year when it diverged from prices, line a. The break of the uptrend, line b, was followed by one more move to the upside before stocks corrected more sharply in January.
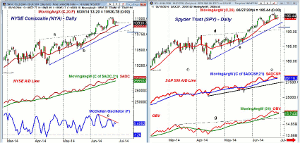
The NYSE Composite (NYA) tested its 20-day EMA last week, which is at 10,896 and just below the July pivot at 10,901. There is chart support, line b, a bit lower with the monthly projected pivot support at 10,777. This corresponds nicely the third quarter pivot.
The NYSE Advance/Decline made further new highs early last week before turning lower. It is still well above its rising WMA and shows no signs yet of a top. It would take several days of very negative A/D numbers to weaken it.
NEXT PAGE: Stocks
|pagebreak|The McClellan oscillator has been diverging from prices but has not been too helpful over the past few months which is sometimes the case. A drop below the zero level could take it down to -125 where it has bottomed recently.
S&P 500
The Spyder Trust (SPY) also tested its 20-day EMA at $194.78 late last week. There is next support at the recent swing low of $192.17. A close below this level could trigger a decline to the breakout level at around $190.50, line d. The third quarter pivot is tentatively at $190.80.
On a move above $196.50, the daily starc+ band is at $197.82 with the weekly at $201.14. The projected monthly pivot resistance is at $199.78.
The daily S&P 500 A/D made a new high early last week but closed just above its WMA. It has short-term support at the June lows while the more important support, line f, is much lower.
The daily on-balance volume (OBV) is also now closer to its rising WMA but did make a new high with prices.
Dow Industrials
In last Thursday's column, I took a look at the Dow Theory as well as the weekly chart of the SPDR Dow Industrials (DIA) which looks ready to close the week a bit lower after briefly testing the prior week's high last Tuesday.
The daily Dow Industrials A/D line is still holding above its WMA but the OBV has dropped slightly below its WMA, which is flattening out.
Nasdaq 100
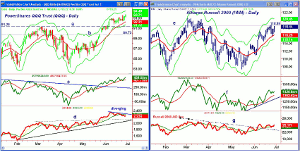
The PowerShares QQQ Trust (QQQ) held up the best last week as it closed higher on Friday and has not tested its 20-day EMA (now at $92.73) since it broke above it early in the month.
The daily starc+ band is now at $94.42 with the monthly projected pivot resistance at $95.73. The weekly starc+ band is at $96.84 with the high from the third quarter of 2000 at $96.09. This could be a partial profit taking zone.
The daily OBV closed the week at new all-time highs and while the weekly OBV (not shown) is rising sharply it has not yet exceeded the early 2014 highs.
The Nasdaq 100 A/D line has been diverging from prices since it peaked on June 6. It has formed two lower highs and is now slightly below its WMA. There is strong support now at line g.
Russell 2000
The iShares Russell 2000 Index (IWM) will be rebalanced along with all of the Russell averages. Though it is trading nearer to the day's highs in late trading Friday it is still lower for the week.
The rising 20-day EMA is now at $116.20 and was tested last week. IWM spiked above the resistance at $118.69 last Tuesday before reversing to the downside. July's monthly pivot is at $116.03 with projected monthly support at $112.80.
The daily starc- band is at $115.10 with the starc+ band at $120.33.
The daily OBV is still in a clear uptrend and is holding above its WMA. It is still well below the March highs.
The Russell 2000 A/D was pretty flat last week as it has not rallied much after breaking its downtrend, line g.
NEXT PAGE: Sector Focus, Commodities, and Tom's Outlook
|pagebreak|Sector Focus
The iShares Dow Jones Transportation (IYT) triggered another daily low close doji sell signal last Tuesday following a similar sell signal early in the month. The weekly technical outlook, as discussed last week, still looks positive as it appears to be in a continuation pattern.
Using the current data, the projected quarterly pivot for IYT starting in July is at $141.89. The weekly relative performance is positive while the daily RS analysis is in a corrective mode.
In a recent trading lesson, Look Inside Your Sector ETF Before You Buy, I emphasized why it is important to check out the holdings of any ETF you buy.
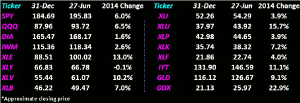
Most of the ETFs have gained in the past two weeks as Select Sector Utilities (XLU), Select SPDR Energy (XLE), Select SPDR Health Care (XLV), and the iShares Dow Jones Transportation (IYT) are all showing double digit gains.
The recent strength in the PowerShares QQQ Trust (QQQ) has pushed it above the Spyder Trust (SPY) as they are up 6.5% and 6.0%, respectively.
The Select SPDR Technology (XLK) has also rallied nicely and is up over 7%.
The Select SPDR Consumer Discretionary (XLY) has improved technically but along with the SPDR S&P Retail ETF (XRT) are both lagging the S&P 500. Technically, they have improved and a strong weekly close could turn them into market leaders.
Bond Market
Bond yields pulled back last week and the ProShares Ultrashort 20+ Year Treasury (TBT) is still holding above its recent lows. This makes the reaction to the economic data this week still long TBT as recommended in On the Lookout for a Bond Market Top.
Crude Oil
The August crude oil contract made further new highs last week at $107.50, which was just below the quarterly pivot resistance at $107.99. It did close the week lower and it may move sideways for a bit as it digests its recent gains.
Precious Metals
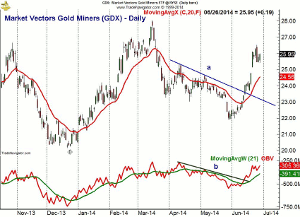
Both the Market Vectors Gold Miners ETF (GLDX) and the SPDR Gold Trust (GLD) are trading well above the late May lows and volume has been good on the rally. The daily chart of GDX needs a pullback to strengthen the chart. There is support at the gap in the $24.78 to $25.14 with the rising 20-day EMA at 24.56. The OBV has broken its downtrend, line b, which is a positive sign.
The Week Ahead
Since the last column we had the FOMC meeting which pushed the market to further new highs. The close Friday was constructive but the market will need to deal with lots of data next week. The trading late Wednesday and Thursday is likely to be thin.
The summer months are tough, as I have frequently mentioned, as I would expect to see several triple digit drops before the summer is over. For many, the best approach is the dollar cost averaging approach in the three widely diversified low cost ETFs that I recommended in A Portfolio That Won't Ruin Your Summer.
A similar approach was initiated in the S&P 500 in early June. The sector ETFs will give you more potential upside but with just a bit more risk. Of course, individual stocks can give you the biggest bang, but along with it, you get a larger risk.
Despite the impressive gains in the major averages, there are still stocks showing up in my weekly scans that are just completing bottom formation and are well below their 52-week highs, so stay tuned.
Because of the Fourth of July, the next column will be on Friday July 11.
Don't forget to read Tom's latest Trading Lesson, Advanced Entry Techniques for Any Market.

