The fear the stock market is rigged, a controversy that ignited with Michael Lewis' latest book, may have stalled market action last week, but MoneyShow’s Tom Aspray thinks focus on rigged markets does a disservice to investors.
The action in the global markets last week was lost in the uproar over the high frequency trading (HFT) controversy that resulted from the new book by Michael Lewis. Though many of his past books have been good reads, I think his biggest triumph may be the marketing of his latest book.
Last week, you could have almost seen Mr. Lewis 24/7 as the bullet point was that the “stock market is rigged.” This likely caused many regular investors to either call their advisors or to alter their plans to invest in the stock market.
In Monday’s column, I expressed my view that this was probably bullish for the stock market, as it would keep bearish sentiment high, as many individual investors would wait to invest. However, I think the focus on rigged markets does a disservice to investors.
As the NY Times pointed out “ But as an investor, high-frequency trading doesn’t matter because you’re focused on the boring work of buying good things and owning them for a long time.” In discussions with veteran traders a year ago, few were concerned about HFT as they had seen little impact on their results.
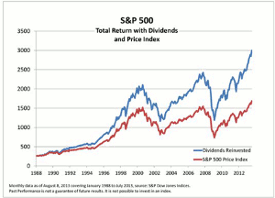
This long-term chart of the S&P 500 compares the price index with the total return that reflects the reinvestment of dividends. Though the bear market pullbacks in 2000 and 2008 were severe, the argument for long-term appreciation in the stock market is strong.
This chart is from last August’s article from David Blitzer of S&P Dow Jones Indices, who pointed out that “One thousand dollars invested in the S&P 500 at the end of January, 1998 would have been worth $5557 at the end of July, 2013. However, if the dividends were reinvested in the index, the investment would be worth $10,635 by the end of July.”
One last comment on what it really means for investors is the generally ignored quote from Mr. Lewis that “It doesn’t follow from the story in the book that you should flee the market.” Too bad there wasn’t more focus on this comment as the dividend’s reinvested chart makes a powerful argument for investing in stocks.
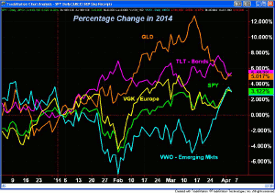
As the first quarter has ended, the performance of many asset classes has seen some significant changes in just the past two weeks. In the middle of March (see chart), the Vanguard Emerging Markets Index (VWO) has gone from down 1.9% to up over 3% as the performance now matches that of the Spyder Trust (SPY).
In fact, for the year, these two markets and the previously recommended Vanguard European Stock Index (VGK) are all now about even as they are up just over 3%. The SPDR Gold Trust (GLD) has given up more of its gains as it is now up just over 5%. (Editor’s Note: This chart does not include Friday’s trading.)
Based on the quarterly pivot point analysis, as discussed in last week’s Follow the Trend with Quarterly Pivots this may have been an important week for both GLD and the Market Vectors Gold Miners (GDX). Both started the second quarter below their new pivots, but rallied last week to close back above their pivots, suggesting that the worst of their decline may be over.
The bond market, as represented by the iShares 20+ Year Treasury Bond ETF (TLT) is still up just over 5% as the yield on the 10-Year T-Note is still locked in it’s trading range. The generally bullish job report last Friday should allow the Fed to stay on its tapering course for the near future.
NEXT PAGE: What to Watch
|pagebreak|From a technical standpoint, I continue to expect yields to eventually breakout to the upside at some point this year. As I stated a few weeks ago, a strong weekly close in the 10-Year T-Note yield above 3.02% would be an upside breakout and signal a move to the 3.4-3.5% area.
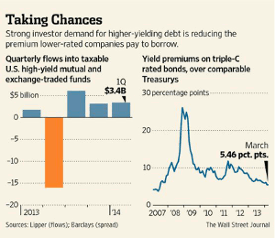
This could be a real problem for those in a high yield mutual fund or ETF bond fund. As the chart indicates, $3.42 billion moved into these instruments in the first quarter. I am afraid that many of the buyers do not fully understand the risk of capital loss in these instruments that could result if yields move significantly higher.
The ECB decided last week to keep their rate at the same level, despite the low inflation rate and the threat of deflation. One surprising fact was that the yield on the 5-year Spanish bonds dropped below that of the US 5-Year T-Note yield. Few would have guessed that this was possible a year ago, as it has not occurred since 2007.
In another important moment for the bond market, Pimco’s Bill Gross noted the passing of his fourteen-year old female Maine coon cat named Bob. He can be seen in the picture above watching Bill on TV. It is nice to see that someone who has over $2 trillion assets under management has a heart, as well as a sense of humor.
The economic data was generally positive last week, though the manufacturing data was mixed. The Dallas Fed Survey reflected strong growth while the Chicago PMI did not. Factory orders were better than expected.
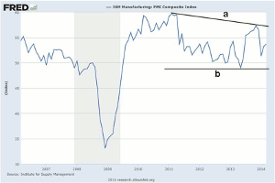
The all-important ISM Manufacturing Index improved from February to 53.7, but was a bit below expectations. The chart shows a slight uptrend but needs to move above the downtrend, line a, to signal strong manufacturing. Of course, a drop below 50 would imply contraction and the chart has important support at line b. The PMI Services Index bounced back nicely after a weak reading in February.
There is a very light economic calendar this week, with the FOMC minutes on Wednesday with Export Prices and jobless claims on Thursday. On Friday, we get the Producer Price Index as well as the preliminary reading from the University of Michigan on Consumer Sentiment.
What to Watch
The technical outlook for the stock market has improved since the last Week Ahead column, despite the wild action on Friday. The S&P futures rallied about six points in early reaction to the jobs report, but in the fist fifteen minutes of the regular session, it had given up all of those gains.
The selling has been the heaviest again in the Nasdaq and Russell 2000, as the large-cap Dow Industrials have held up better, so far. By early afternoon, the Dow was down 0.47%, while the Nasdaq Composite was down 2.25%.
As I discuss in more detail below, the outlook for the overall market, based on the NYSE Composite, is positive from both a weekly and daily perspective. This suggests that this is a pullback within an uptrend, not the start of a major correction.
On the other hand, the daily outlook for the biotech-heavy Nasdaq 100 and Powershares QQQ Trust (QQQ) is negative, while the weekly analysis is still positive. The relative performance analysis warned several weeks ago that the QQQ was no longer a market leader and the recent action has confirmed it.
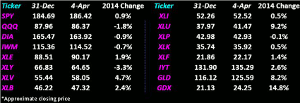
The majority of sector ETFs are still going to close the week above their new quarterly pivots (see table) as these pivots did provide a pretty good guide in the first quarter.
The bond market rallied last week, but that has not changed my argument in favor of stocks over bonds. Therefore, I continue to favor shortening the maturity of your bond portfolio and would have strict risk controls in place for holders of high yield funds or ETFs.
NEXT PAGE: Stocks
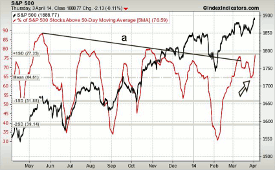
|pagebreak|The five-day MA of the percentage of S&P 500 stocks above their 50-day MAs has risen sharply over the past two weeks from the 64% area to 76.6%, as of Thursday’s close. This is a new high and suggests that the break of the downtrend from last May, line a, was legitimate.
According to AAII, the individual investors turned a bit more bullish last week as the % bullish rose from 31.2% to 35.4%. Still, only 26.7% are bearish, which is still too low as it was 36.4% on February 6.
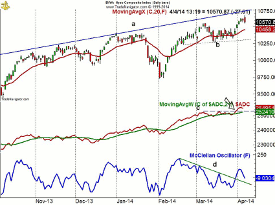
The daily chart of the NYSE Composite shows that it is still well above the 20-day EMA at 10,456. The daily starc- band is at 10,366, which is quite close to the monthly projected pivot support. There is chart support at 10,300, line b, with the quarterly pivot at 10,220.
The daily NYSE Advance/Decline made another new high last week as it had overcome the resistance at line c last month. The weekly A/D line (not shown) made another new high at the end of March and continues to act stronger than prices. Both are holding well above their rising WMAs.
The McClellan oscillator broke its downtrend (line d) last Monday, indicating that the correction was over. It dropped back below the zero line on Friday and could retest the former downtrend before the correction is over.
S&P 500
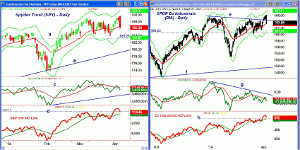
The daily chart of the Spyder Trust (SPY) shows Friday’s sharp drop as it closed just above the 20-day EMA at $186.48. The daily starc- band is now at $183.59 with quarterly pivot at $183.25, line a.
There is initial resistance now in the $188-$188.60 area and then at last Friday’s early high of $189.70. The daily starc+ band has now risen to $191.20 with the weekly at $193.88.
The daily OBV broke out to the upside in late February and made convincing new highs in March. Since then, it has formed lower highs as it has diverged from prices and is back below its WMA. The weekly OBV (not shown) gives a much different picture as it made a new high two weeks ago and is rising with last week’s higher close.
The daily S&P 500 A/D line made significant new highs last week as it is well above the support at line d.
Dow Industrials
The SPDR Dow Industrials (DIA) also managed to close the week higher, but well off the best levels, as it hit a high of $166.06 which was well above the prior high. The daily chart shows the breakout above the resistance at line e, and then the close on Friday back below the breakout level.
The rising 20-day EMA at $163.40 should provide first support with further in the $162 area. There is more important support in the $160.52 area with the quarterly pivot at $160.88.
The daily on-balance volume (OBV) continues to look weak as it has formed lower highs, line g, and is back below its WMA. In contrast, the weekly OBV is still above its WMA and is close to making new highs.
The daily Dow Industrials A/D line did confirm the upside breakout as it was able to move through the resistance at line h. It is also above its rising WMA and should not drop below the late March lows.
Nasdaq-100
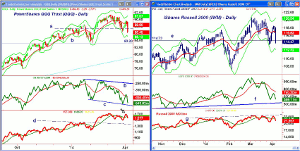
The daily chart of the PowerShares QQQ Trust (QQQ) shows the sharp drop on Friday as it closed below the quarterly pivot, line a, at $87.47. As noted at the time, a weekly low close doji sell signal was triggered on March 14.
The March low is at $86.40 with the monthly projected pivot support at $85.66. There is even stronger support at the February low of $83.20, line b. The daily starc- band is now at $85.10 with the weekly.
There is next support at $88.45 and the monthly pivot. The 20-week EMA is at $86.17 and the trend line support is at $85.50. The weekly starc- band is a bit lower at $84.11.
The weekly relative performance (not shown) will close sharply lower this week and is so far below its WMA that it is oversold.
The daily OBV has continued to form lower highs, line b, since it peaked in January. It has also formed lower lows, line c, but is now getting closer to support from the October 2013 lows. In contrast, the weekly OBV (not shown) is still above both its trend line support and its rising WMA.
The Nasdaq 100 A/D line was strong last week, but failed to make a new high (see arrow) even though it came close. If it drops below the most recent low it is likely to test the breakout level.
The QQQ now needs a close above last week’s high at $89.68 to stabilize.
Russell 2000
The iShares Russell 2000 Index (IWM) shows a similar plunge as the QQQ, as it closed below the quarterly pivot, line e, at $114.70. It did close the week lower with next support at $113.69 which was the prior week’s low. The daily starc- band is at $112.32 with the weekly at $110.31.
The weekly relative performance, after breaking out to new highs in early March, has reversed and fallen below last fall’s lows.
The daily OBV failed to reach its declining WMA last week and is now getting close to long-term support at line f. The weekly OBV (not shown) is ready to close below its WMA, so the multiple time frame OBV analysis is now negative. The weekly is still above trend line support.
The Russell 2000 A/D line failed to move above the resistance, at line g, last week and has closed below its WMA.
There is first resistance now for IWM at $116.81 and the 20-day EMA, with further at last week’s high of $118.48.
NEXT PAGE: Sector Focus, Commodities, and Tom's Outlook
|pagebreak|Sector Focus
The iShares Dow Jones Transportation (IYT) was down over 1% on Friday, but still closed the week with nice gains. Tuesday’s close at $136.66 completed the continuation pattern on the daily chart. This gives upside targets in the $139-$140 area with the daily starc+ band now at $139.52.
The rising 20-day EMA at $134.86 was tested on Friday with more important support now at $132.63, which is the quarterly pivot.
The weekly relative performance and OBV (not shown) are still above their WMAs and therefore positive.
The SPDR Dow Industrials (DIA) , iShares Russell 2000 Index (IWM), and PowerShares QQQ Trust (QQQ) are all now negative for the year, while the Spyder Trust (SPY) is up less than 1.0%.
The Select SPDR Utilities (XLU) is still leading the pack, up 9.2%, followed by the 4.7% gain in the Select SPDR Health Care (XLV), which has given up a fair share of its gains.
The Select SPDR Energy (XLE) is up 1.9% as many of the oil stocks are acting well. They will look even more attractive on a pullback. The Select SPDR Materials (XLB) is doing even better, up 2.4%.
The Select SPDR Consumer Discretionary (XLY) and the Select SPDR Consumer Staples (XLP) are both still negative on the year.
The Select SPDR Financials (XLF) was up 2.6% two weeks ago but is now only up 1.4%. The regional banks pulled back on Friday but are still holding above support.
Crude Oil
Crude oil had a wide range last week and closed lower. The weekly OBV is still positive and a close back above the four week highs at $101.40 is needed for an upside breakout.
Precious Metals
Both the SPDR Gold Trust (GLD) and the Market Vectors Gold Miners (GDX) opened the quarter below their second quarter pivots, but GLD did manage to rally late in the week to close at $125.59, which was well above the pivot at $124.80. The GDX closed just slightly below its pivot at $24.30.
The Week Ahead
In the two weeks since my last column, there have been quite a few significant changes as the Nasdaq 100 and Russell 2000 have been hit hard as they are now down for the year.
Much of this came on Friday as the selling was quite heavy in both indices. Most of the major averages did close off the day’s lows as prices stabilized in the last hour. There was some technical damage, especially in the high momentum stocks that were crushed.
We have been seeing a sector rotation for much of the year and it has now become more pronounced. If this is just a pullback in the NYSE Composite and Spyder Trust (SPY), which is consistent with the new highs in their A/D lines, then we should get a rally by the middle of the week.
The negative readings on the daily technical studies for the Nasdaq 100 and Russell 2000 make it quite likely that they will have weak rebounds. There needs to be some consolidation and it will take time before they could complete daily bottom formations.
For the S&P 500, there is next strong support in the $1843-$1855 area which includes the monthly projected pivot support. A decisive close below 1840 would then make a drop back to the 1820 level more likely.
That said, there are still quite a few stocks with good-looking charts that show positive relative performance and volume patterns. They are still well above good support and, once the market stabilizes, they are poised to be the new market leaders.
As I advised two week’s ago, “keep watching any stocks in your portfolio and note how they are doing when compared to the S&P 500. Adjust your stops if you see a stock that is starting to lag, and, if you are getting nervous about your position in the stock market, take some profits, as you can always get back in.” This is still my recommendation as you need to have a plan and stick with it.
There is no change for those who are following the dollar cost averaging in either the S&P 500-tracking ETF or Vanguard Emerging Markets (VWO) that I discussed in the January 24 column, A Path to Investing Success in 2014. The position in the emerging markets is now looking better and VWO appears to have bottomed.
Those who are not invested at all should consider starting a dollar cost averaging plan if the S&P 500 drops to 1830 or lower. Make your investment that day and then four more equal purchases every two weeks until you are fully invested.
Don't forget to read Tom's latest Trading Lesson, Follow the Trend with Quarterly Pivots.

