As the US stock market ended February on a high note, MoneyShow's Tom Aspray examines whether stocks can push even higher in the months ahead.
As the major averages made their lows in early February after a dismal January performance, it was hard to find all the bullish analysts that were dominant at the end of 2013. The Dow Industrials had lost 5.6% in January while the S&P 500 lost 3.6%.
Those who believe that a lower January means a down year for the market were also nervous about doing some new buying The so-called January barometer has been right 73% of the time in the last 35 years, but as I pointed out in early February, it has been wrong five times since 2000.
As I noted then, in each of those years, the positive readings from the NYSE Advance/Decline favored a bullish outlook for stocks in those years. The current strong readings and the additional new highs in the A/D line are bullish for 2014. The drop from the mid-January highs was enough to briefly reduce the too-high bullish sentiment, but as we get the long-awaited spring thaw, what can push stocks higher in the next few months?
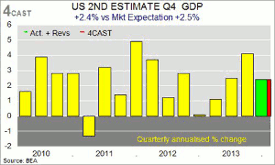
Friday's weaker-than-expected revision of 4th quarter GDP to 2.4% made some traders nervous in early trading, but it did not last long. Apparently, many were not ready to believe the new Fed Chair Janet Yellen when she attributed the weak economic data to the weather. As one who has spent this winter in the middle of the East Coast weather, I find her explanation easy to believe.
Many other market analysts are not buying stocks because of the bond market's action, so far, in 2014. The yield on the 10-year T-note closed 2013 at 3.023% and is now trading around 2.687%. Typically, one expects that rates will move higher as stocks rally since the price appreciation in the stock market is assumed to reflect an improving economy.
Bond traders are thought by many to be more astute than stock traders so some have concluded that the lower yields mean that the economy is actually weaker than most expect. I think there may be another explanation.
Last week's sale of $35 billion in 5-year Treasury notes went very well as there were $2.98 in bids for every $1 offered. This was followed on Thursday by the sale of $29 billion in 7-year notes, which was also well received. In total, $109 billion were sold and demand was high, making it one of the best auction weeks since 2012. Overseas demand was high and many global investors, in my opinion, think the US is the best place to invest in safety. I think this can explain the divergence between stocks and bonds.
In Friday's Wall Street Journal, it was pointed out that the overall trading volume in the popular Spyder Trust (SPY) has been relatively low; about 20 million shares lower than it was during the same period last year.
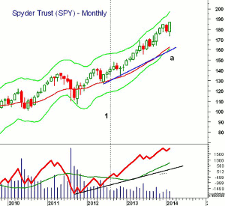
The monthly chart of SPY, along with its on-balance volume (OBV), paints a much different picture. The monthly OBV moved above its WMA in August of 2012, line 1, and continues to suggest strong accumulation of this ETF.
The SPY has gained over 32% and the OBV shows a pattern of higher highs with another new high in December. It is very close to making another new high in February and will make a new high in March if the SPY closes higher. The SPY is still 5.6% below its monthly starc+ band for March, which is at $197.
In the Eurozone, the main focus was on the problems in the Ukraine and the saber rattling by Russia. The Russian ruble was hit hard last week as was their stock market. It looks like the post-Olympic glow is over. The Eurozone did get a surprise late last week when inflation came in a bit higher than expected. This should allow the ECB to leave rates unchanged for now.
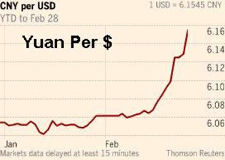
On the global front, the biggest news was the sharp drop in the Chinese yuan. It apparently was the result of the action of the People's Bank of China as they instructed the large state-controlled banks to aggressively buy dollars.
On the chart, the rise in the rate (weakening yuan) looks pretty dramatic, but for the currency markets, it was not a big percentage move. However, for a currency that normally trades in a tight range and is tightly controlled by the government, the move was significant. Continued weakness in the yuan could give its economy a much-needed boost as it will make their goods more attractive.
NEXT PAGE: What to Watch
|pagebreak|There was some negative economic data last week like the downward revision in the GDP on Friday and lower-than-forecast Consumer Confidence report, Tuesday, which was weaker than expected. There were also a number of bright spots as New Home and Pending Home Sales were better than expected.
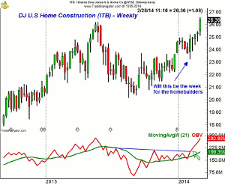
This gave the homebuilders a boost as the iShares Home Construction ETF (ITB) was finally able to move above the May 2013 highs. The volume has been strong as the OBV is rising sharply after breaking out. There were signs at the end of January, Will This Be the Week for the Homebuilders?, that this was becoming a market-leading sector. Now, ITB is up over 13% from its lows and has the potential to go much higher after a pullback.
Also last Friday, we got the final numbers on consumer sentiment for the month from the University of Michigan. They have held up well during winter's onslaught and this allows for some pent-up demand to hit the markets when the weather improves. The Chicago PMI was also better than expected as this composite business index moved higher. I expect even better economic numbers in the coming months to justify higher stock prices.
This week, the focus will be on the monthly jobs report due out on Friday but there are plenty of data early in the week that may also move the markets. On Monday, we get the Personal Income and Outlays, the PMI Manufacturing Index, the ISM manufacturing Index, and Construction Spending.
The ADP Employment Report, ISM Non-Manufacturing Index, and the Beige Book are scheduled for Wednesday. In addition to the jobless claims, on Thursday, we also get new data on Productivity and Costs, as well as Factory Orders.
What to Watch
The week started of with lots of skepticism as the S&P could not hold Monday’s gains and retests of those highs were rebuffed until Friday when they were overcome in a convincing fashion. Despite the bullish price action and strong market internals, it is surprising that many analysts remain cautious to bearish.
The continued strength of Tesla Motors (TSLA) has some drawing comparisons to the Nasdaq bubble in 2000. Those of you who were trading then will remember that there were a large number of stocks then that were acting like Tesla is now and the sentiment amongst the public was much different as the public was much more heavily invested in stocks.
In the review of the Charts in Play portfolio, I looked at those stocks that were stopped out in the late January slide, as well as the new positions that were added near the February lows.
I also took a look at the heavily shorted regional banking sector and recommended the SPDR S&P Regional Banking ETF (KRE) that was sharply higher last Friday. There are still quite a few stocks that unlike Tesla have not moved sharply higher in 2014 but as always one must focus on the risk of any new positions.
The sentiment was a little less bullish last week as the number of bullish individual investors dropped to 39.69% from 42.22% the previous week according to the AAII survey. The % of bears is still quite low at 21.13%
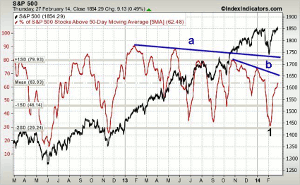
The five-day MA of the number of S&P 500 stocks above their 50-day MAs is now up to the 62% area, which is very close to the mean. In my view, this means the risk here is not either high or low and selective buying can be done. It is much different than it was in early February when it was just above 30% (point 1) or at the start of the year when it was 75%.
The % is still below both the short term (line b), as well as the long-term downtrend, line a. This divergence could be a negative sign and a move in the % above the late-2013 high will be a sign of better strength.
NEXT PAGE: Stocks
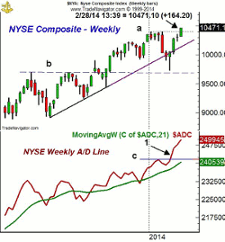
|pagebreak|The weekly chart of the NYSE Composite shows last week’s close well above the January highs, line a. This upside breakout has measured targets in the 10,900-11,100 area. The weekly starc band will be at 10,575 next week and the quarterly projected pivot resistance at 11,048. This is consistent with the measured targets from the chart formation and is about 4.7% above current levels.
The rising 20-day EMA is at 10,268, which is very close to the monthly pivot for March at 10,221. There is further support in the 10,000 area with the monthly projected pivot support at 9971.The February low of 9738 is now a major level of support.
The weekly NYSE Advance/Decline continues to rise quite sharply, which is a very bullish sign, even though the gap between it and the 21-period WMA is a bit large. The A/D line broke through its resistance at line c a few weeks ahead of prices (point 1).
The McClellan oscillator (not shown) is still below its recent peak at +216 but is still in a short-term uptrend and above near-term support.
S&P 500
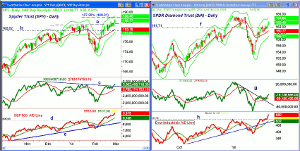
The Spyder Trust (SPY) has decisively moved above the resistance the bears have been watching, line a, on Friday. Once these gains are confirmed by another day or two of holding above this level, the 127.2% Fibonacci retracement target is at $188.01.
The daily starc+ band is a bit higher at $188.44 with psychological resistance at $190.
The 20-day EMA has risen now to $183.33 with weekly support in the $181-$182 area. The rising 20-week EMA is now at $179.67.
The daily on-balance volume (OBV) has broken through the resistance at line c, but is still below the November highs. The weekly OBV has also not yet made new highs though it is very close to the old highs, and as noted earlier, the monthly OBV is strong.
The S&P 500 A/D line is rising sharply, which as I have noted in previous articles on the A/D line (One Indicator Stock Traders Must Follow), is normally a very positive sign as it is acting stronger than prices. Support for the A/D line is at its rising WMA and then at line d.
Dow Industrials
The daily chart of the SPDR Dow Industrials (DIA) does show a pattern of higher highs but is currently still about 1% below the early-2014 high of $164.93. The old high is now very close to the daily starc+ band at $164.80. The weekly starc+ band is now at $166.21.
There is initial support now at $161.70 with further in the $159.50-$160 area. The quarterly pivot is at $158.58.
The daily OBV has moved more strongly above its rising WMA and the former downtrend, line g. The OBV is still well below the highs made early in the year. The Dow Industrials A/D line has overcome the resistance at line h and has made a new high. It is now acting stronger than prices.
Nasdaq-100
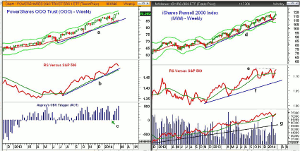
The weekly chart of the PowerShares QQQ Trust (QQQ) shows that the ranges have narrowed over the past two weeks as nervousness about the tech sector has spread. It formed a doji last week with key support still at $89.31. A weekly close below this level would trigger a low close doji sell signal.
The monthly projected pivot resistance at $90.82 was exceeded on Friday with the daily starc+ band at $91.75 and the quarterly projected resistance at $95.47.
There is support now at $88.80 to $90, which includes the rising 20-day EMA. The daily starc- band is a bit lower at $88.25, which is also the monthly pivot for March.
The weekly relative performance has turned down but is still in a clear uptrend, It is well above both its uptrend, line b, and its rising WMA. The daily RS line (not shown) has dropped below its WMA but did confirm the recent highs.
The Aspray’s OBV Trigger (AOT) dropped close to the zero line at the February lows (point c) before triggering a buy signal. The AOT is now back to the previous highs.
The Nasdaq 100 A/D line (not shown) made new highs last week after staging a major breakout early In February. It is well above its rising WMA.
Russell 2000
The iShares Russell 2000 Index (IWM) made new weekly highs last week at $118.71, which was well above the January high of $117.31. The daily starc+ band is now at $119.76.
There is first good support now at $115.50-$116 with the rising 20-day EMA at $114.88.
The weekly relative performance is now testing its previous highs, line e, and an upside breakout will signal that the small-cap stocks are once again leading the market higher.
The weekly OBV is back above its WMA but is still below the highs from earlier in the year. The daily OBV (not shown) looks much stronger as the volume was very strong in February and it is well above the previous highs.
NEXT PAGE: Sector Focus, Commodities, and Tom's Outlook
|pagebreak|Sector Focus
The iShares Dow Jones Transportation (IYT) looks ready to close above the prior four-week highs, which has shifted the momentum further into positive territory. It is still below the all-time closing high of $135.54. The projected monthly resistance for March is at $134.75 with the weekly starc+ band at $138.32.
Initial weekly support is in the $130 area with rising 20-week EMA at $127.80. Key support is now at the February low of $125.50.
The weekly relative performance (not shown) is still below its WMA but it did confirm the previous highs. The weekly OBV made a new all-time high last week.
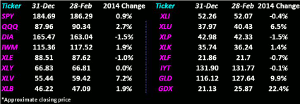
All of the market-tracking ETFs, except the SPDR Dow Industrials (DIA) are in positive territory for the year as DIA is still down around 1.5%. The PowerShares QQQ Trust (QQQ) continues to be the strongest index, up 2.7%, while the Spyder Trust (SPY) is now up close to 1%.
The Select SPDR Health Care (XLV) and the Select SPDR Utilities (XLU) are still the strongest by a wide margin as the XLV is now up over 7% in the first two months of the year with XLU up 6.5%.
The Select SPDR Materials (XLB) broke out to the upside last week on good weekly volume as I noted in the middle of the week. The XLB is now up close to 2% for the year as it has turned around sharply.
The Select SPDR Consumer Discretionary (XLY) is unchanged for the year as the retail stocks were strong last week. Many of the stocks did report earnings that were worse than expected but still closed strong. Macy’s Inc. (M) reported that 244 of its stores were closed at some point this year because of the weather but had a great week. It seems as though this is the new Teflon industry group that should be watched when the weather gets better.
The Select SPDR Energy (XLE) is still down 1% as it failed to rally late in the week while the overall market was higher. The normally safe Select Consumer Staples (XLP) is still down close to 1.5% for the year as higher-beta stocks are still favored.
Crude Oil
Crude oil ended higher for the seventh week in a row as the close above the late-2013 highs a few weeks ago was bullish. There is next resistance in the $102.50 area, which corresponds to the early 2012 highs. The weekly OBV (not shown) has been above its WMA since the middle of January and still looks strong.
Precious Metals
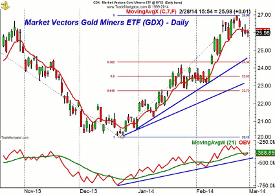
The SPDR Gold Trust (GLD) closed the week higher while the Market Vectors Gold Miners (GDX) was a bit lower. The daily chart of GDX suggests the long-awaited correction may be underway. A close below $25.50 should signal further selling with the 38.2% retracement support now at $24.34. I will be watching this market closely for signs that the pullback is over.
The Week Ahead
The market was sharply higher in early trading Friday after it digested the somewhat-disappointing data on the GDP. Just after lunch, the market turned lower and moved well into negative territory. The market rebounded in the last hour to close back in positive territory.
It is clearly a split market as while some stocks like the agricultural chemicals discussed last week have just bottomed, others are overextended. Therefore, one cannot be an indiscriminate buyer as one should not be chasing any stocks especially those that are in the news.
There are quite a few industry groups that are looking fairly good and that are currently out of favor. These, I think, will provide the best new buy candidates.
I continue to think that both the US and Eurozone economies will weather the period of soft data, and I am looking for better numbers in the comings months. I continue to think this will be a positive for the materials and industrial sectors.
I think it is also possible that patient investors will be rewarded in the emerging markets and the recent action in the Chinese yuan could be an early indication that a bottom is forming in China’s market. I also still like Europe as I adjusted my buy levels and updated my strategy on Japan a few weeks ago.
No change for those who are following the dollar cost averaging in an S&P 500-tracking ETF or mutual fund that I recommended in the January 24 column, A Path to Investing Success in 2014.
Remember, do not get in a panic that you have to buy or sell at any point as emotion is an investor’s worst enemy. Work on your strategy over the weekend when the markets are closed.
Don't forget to read Tom's latest Trading Lesson, My Favorite Chart Patterns.

