As a new quarter gets underway, MoneyShow’s Tom Aspray explains why it is important to analyze and monitor the quarterly pivots to determine if this Friday’s close will signal any new trend changes.
After just two days of stock market trading, it looks as though this will be another volatile week to start off the New Year. Though most of the major averages did close the day lower, they did settle above the worst levels, which was moderately encouraging. The market internals ended the day just slightly negative.
The Dow’s 400 point swing certainly got the financial media’s attention, but it was also probably another reason for new investors to stay out of the markets. I have found the weekly closing prices to often be more important, especially in times of high volatility.
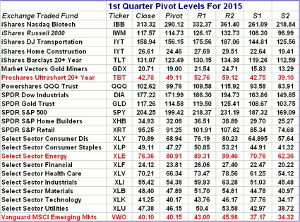
Since December 2012, I have published a table of the quarter’s pivot levels for some of the key ETFs that I follow. These pivot levels had been revealed to me several years earlier by John Person and I have found them to be a quite valuable technical tool.
In The Most Powerful Pivot Level, I discussed my simplistic approach to using these levels. The weekly trend is determined by whether a market average, stock, or ETF has a weekly close above or below their quarterly pivot levels.
The quarterly support and resistance levels also give me some valuable insights. In many instances, a market will top out at quarterly resistance that often also corresponds to weekly or monthly starc bands.
As of Friday’s close on January 9, only four of the ETFs (highlighted in red) had weekly closes below their pivot levels, even though some of the other ETFs had traded below their quarterly pivots earlier in the week.
As of Tuesday’s close, there are quite a few ETFs including the Sector Select Financial (Big Banks: Are the Charts Really That Bad?) that are now trading below their quarterly pivots.
A review of the quarterly pivot analysis of the Spyder Trust (SPY), as well as some of the best and worst ETFs from 2014 to 2015 will help you better evaluate this method of analysis.
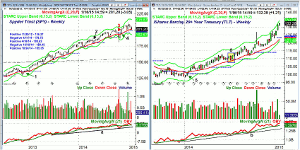
Chart Analysis: This chart of the Spyder Trust (SPY) goes back to the fall of 2012 and reveals only four signals over the past twenty-five months.
- On November 30, 2012, the SPY closed at $136.37 (point 1), which was above the quarterly pivot of $135.32.
- The week of October 11, 2013, SPY dropped below its pivot ($163.18) during the week as it had a low of $160.51, but then closed the week back above the pivot.
- On Friday, April 11, 2014 (point 2), the SPY closed at $178.75, which was below the 2nd quarter pivot of $180.28.
- This signal was reversed the next week as SPY closed at $183.62.
- The quarterly pivot was again violated on a weekly closing basis on October 10, 2014.
- As was the case in April of 2014, the SPY closed the next week at $195.34, which was back above the quarterly pivot at $195.12.
- For the 1st quarter of 2014, the pivot is at $199.42.
- The weekly OBV is pulling back to its WMA but is well above long-term support at line a.
The iShares Barclay 20+ Year Treasury (TLT) was up 27.30% in 2014 and has already added another 4.69% in 2015.
- The second week of 2014, TLT closed at $101.39, which was above the quarterly pivot at $100.60.
- The previous week, a doji had formed so a high close doji buy signal was also triggered.
- At the start of the 3rd quarter (point 6), TLT dropped to a low of $108.78 on Thursday and closed at $109.12.
- This was below the quarterly pivot at $109.82.
- After the 4th of July holiday weekend, TLT rebounded to close at $111.98 and back above the pivot.
- TLT has stayed solidly above the quarterly pivot for the rest of the year.
- The 1st quarter pivot at $123.49 is well below last Friday’s close at $131.07.
- The weekly OBV tested its WMA at the end of 2014 before turning higher.
Next: A Best and a Worst ETF from 2014 to 2015 to Watch
|pagebreak|
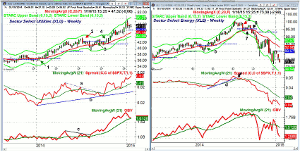
The Sector Select Utilities (XLU) did even better than TLT in 2014 as it was up 28.73%, but has lagged TLT so far in 2015.
- XLU closed at $36.92 on January 10, 2014 (point 1), which was above is quarterly pivot of $36.61.
- It stayed positive until just before the July 4th weekend (point 2) when it closed at $41.56.
- This was below the 3rd quarter pivot at $42.31.
- This signal lasted nine weeks until September 5 (point 3) when it closed at $42.85.
- XLU dropped the next week to reverse the positive signal with the close at $41.51, which was back below the pivot.
- By October 10 (point 4), the week before the stock market bottomed, XLU closed above the 4th quarter pivot.
- This signal is still intact and the 1st quarter pivot is at $46.15.
- The weekly technical studies have supported the pivot analysis.
- The relative performance formed a negative divergence at the April highs, line a.
- This resistance was overcome at the start of the 4th quarter and the RS line continues to act strong.
- The OBV had a similar pattern as its resistance, line c, and was overcome in August.
- The quarterly R1 resistance is at $50.40.
The Sector Select Energy (XLE) was down 8.70% in 2014 but in late June it was up 15.8% for the year as it has had a wild ride in 2014.
- With the February 14 close of $84.25, XLE was barely back above the pivot at $84.22 (point 5).
- This signal stayed in force until August 1, 2014 when XLE dropped sharply to close at $94.77 (point 6), which was below the pivot at $95.39.
- This signal was reversed three weeks later (point 7) as XLE rallied to a high of $97.73.
- On the September 12 close of $92.51 (point 8), XLE was back below its pivot.
- As of last Friday, it has dropped 17.4% and the 1st quarter pivot is at $80.91.
- The RS line broke its uptrend, line c, and its WMA in August, signaling it was now acting weaker then the S&P 500.
- By the end of September, the weekly OBV was plunging sharply.
- The S1 support is now at $70.76 with the weekly starc- band at $66.94.
What it Means: In addition to the XLF, the Sector Select Technology (XLK), Sector Select Materials (XLB), and Sector Select Industrials (XLI) are currently trading below the quarterly pivot.
As you can see from these examples, the quarterly pivot analysis, like any approach, does generate some whipsaw signals, but also can alert you to some important trend changes.
By monitoring the quarterly pivots each week you can be alerted to some good profit opportunities.
How to Profit: No new recommendation.


