Gold prices and the precious metal mining companies have bounced from the November lows, so MoneyShow’s Tom Aspray takes to the charts to determine if this recent rally changes the intermediate trend.
Yesterday’s stock market rally came right on time basis the short-term technical readings and the building bearish sentiment I discussed in Tuesday’s Bearish Sentiment Creates Buying Opportunity. The market internals were strong and the futures are sharply higher again early Thursday.
The daily technical studies have turned up from support, but a further rally over the next few days is needed to confirm that the market’s correction is over. A strong close in the Spyder Trust (SPY) above $205.50 would be a bullish sign. It is not possible yet to rule out another push to the downside before the correction is over.
According to AAII, the bullish sentiment has dropped sharply in the past week, from 51.74% to 41.01% in the latest survey. A disappointing jobs report on Friday could dampen the upside momentum, while a better than expected number could fuel another spurt to the upside.
Gold prices and the precious metal mining companies have bounced from the November lows. The February Comex gold contract had a low of $1132 on November 7 but closed Wednesday at 1210.7 as it is up 6.9% from the lows. Many are now wondering if this recent rally changes the intermediate trend.
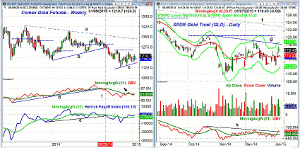
Chart Analysis: The weekly chart of the Comex continuous gold contract completed a flag formation (lines a and b).
- The minimum downside targets have been met with further in the $1080-$1100 area.
- The quarterly projected pivot support is at $1064.
- The quarterly pivot is at $1190 so a close Friday above this level would be positive.
- Gold stayed below its quarterly pivot throughout 2014.
- The weekly on-balance volume (OBV) broke its uptrend in early August and by the month was in a clear downtrend, line 1.
- The OBV bounced above its WMA three weeks ago but is now slightly below it.
- The Herrick Payoff Index uses price, volume, and open interest to determine the flow in or out of a commodity.
- The HPI dropped below zero and support, line e, in August.
- This indicated that money was flowing out of gold.
- The HPI is now above its WMA but is still below zero.
- There is next resistance at $1239 with the quarterly projected pivot resistance at $1249.7.
The SPDR Gold Trust (GLD) was down just over 2% in 2014 but has been holding well above the early November lows at $16.34.
- GLD has bounced back to the November highs but closed lower Wednesday.
- The daily downtrend, line g, is in the $118 area with the daily starc+ band at $118.74.
- There is more important resistance in the $120-$120.50 area.
- The daily OBV dropped to new lows in November but has subsequently held well above those lows.
- The resistance, at line h, was slightly overcome this week as it is above its WMA.
- The weekly OBV (not shown) is also holding above its WMA.
- The rising 20-day EMA is at $115.02 with more important support at $112.32.
- The monthly projected pivot support is at $111.00.
Next: Two More Gold Miners to Watch
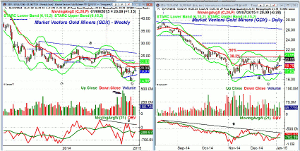
|pagebreak|The Market Vectors Gold Miners (GDX) was up nicely in early 2014 but closed down -12.42% for 2014.
- The weekly chart shows a short-term uptrend, line b, as the 20-week EMA is being tested.
- The volume was strong at the November low (see arrow), which was a positive sign.
- The volume over the past few weeks has not been as heavy.
- The weekly OBV made new lows with prices in November before rallying sharply.
- The OBV is close to closing above its WMA this week with resistance now at line c.
- There is weekly support now at $16.97 and then at $16.34.
- A break of these levels could signal a drop to the quarterly projected pivot support at $13.23.
The daily chart of the Market Vectors Gold Miners (GDX) shows that the 38.2% Fibonacci resistance at $20.60 was slightly exceeded Wednesday before GDX closed down 1.86% for the day.
- The 50% retracement resistance from the August high is at $21.92.
- There is first good support at $18.79 and the 20-day EMA, with the quarterly pivot at $18.91.
- If the trading since the November low is a continuation pattern, then support at line d, is critical.
- A break of this support would project at decline to the $14-$14.30 area.
- The daily OBV is back above its WMA, which has turned up slightly.
- The OBV has more important resistance at the downtrend, line e.
What it Means: The technical outlook for gold and the gold miners has been negative since last summer, and in September’s 3 Things Gold Owners Should Know, I warned of another drop that investors should become prepared for.
The yearly analysis does allow for a turnaround in 2015 but there is much technical work to be done. Some of the individual gold mining stocks do show potential double bottom formations, but they have not been confirmed yet.
Therefore, even though both GLD and GDX have held up a bit better than expected, there are no signs of a change in the major trends.
How to Profit: No new recommendations.


