Many market bears have prematurely proclaimed the end of the bull market in the past, so MoneyShow’s Tom Aspray uses technical analysis to point out some reasons why the current decline may more likely be a buying opportunity.
The further collapse in crude oil prices Monday hammered stock prices and the selling has continued early Tuesday. The drop below $50 in the March crude oil contract has been accompanied by a sharp decline in the open interest as margin calls likely forced traders to sell their longs. Crude could complete a short-term low in the next week.
The market internals were solidly negative and the Dow Transports lost 2.66% versus a 1.83% drop in the S&P 500. Though the short-term momentum is negative, there are several reasons to view the current decline as a buying opportunity.
The four day slide has caused many of the market bears to come out of hibernation with morning headlines like “A bear market in stocks just became more likely.” Some of this new bearishness is tied to the apparent failure of the Santa Claus rally.
Of course, basing an investment or trading strategy on how the market performs over a seven-day period is hard for me to fathom. I have always stressed that buying or selling based on historical or seasonal tendencies, when the technical studies are not confirming, is a prescription for disaster.
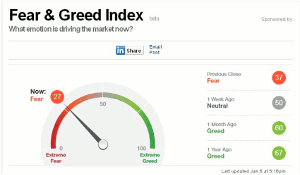
Concerns about the EuroZone and continued worries over the economy in light of crude oil prices were also cited by many of the market bears. The CNN Fear & Greed Index is now at 27 (Fear) after being at 60 (Greed) just a month ago. It reached single digit levels near the August lows. The ARMS Index closed at 2.18, which is already at oversold levels.
Many of the current market bears have proclaimed the end of the bull market in the past years as the bull market has moved higher despite the prevailing skepticism. This unfortunately has kept many investors out of the market during this bull market.
The technical discussion below outlines some of the many positive technical reasons why the current decline is more likely to be a good buying opportunity. Investors and traders should keep an eye on the key support levels for the major indices.
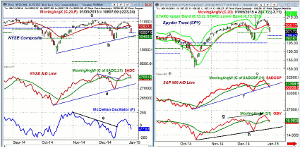
Chart Analysis: The NYSE Composite closed Monday just above the quarterly pivot at 10,597.
- The close was also on the daily starc- band, while the monthly projected pivot support is at 10,463.
- The December low at 10,350 is now more important support with the weekly starc- band at 10,220.
- The NYSE Advance/Decline Line made a new high last week, though prices did not.
- This is historically a very bullish sign as it is typically followed by new highs in the NYSE Composite.
- The A/D line broke its short-term downtrend (line c) near the December lows and has dropped slightly below its WMA with Monday’s close.
- The A/D line has further support at the uptrend, line d.
- The McClellan oscillator broke its downtrend, line e, on December 18 and rallied back to +117.
- It closed Monday at -77.67, with next support at -150.
- The NYSE has first resistance now at 10,823 and the declining 20-day EMA.
The Spyder Trust (SPY) did make new highs last week but closed Monday below its starc- band.
- The quarterly pivot support is at $199.42, which, of course, needs to be watched on a weekly closing basis.
- The monthly projected pivot support is at $197.61 with the December low at $196.77.
- There is an additional band of support in the $193.20-$194.50 area.
- The S&P 500 A/D line made a new high last week but has now dropped below its WMA.
- The uptrend from the October lows, line f, has been broken, but the WMA has not topped out.
- The daily OBV confirmed the new price highs last week (line g), which is not consistent with an important top.
- The OBV is slightly below its WMA but well above the long-term support at line h. The weekly OBV (not shown) also made a new high.
- There is first resistance at $107.70 and then $108.23, which corresponds to the 20-day EMA.
- In the last quarter of 2014 the pivot resistance at $207.29 was reached, which seemed unlikely in early October.
- For the first quarter of 2015, the projected pivot resistance is at $230.30.
Next: Two More Key Indices to Watch
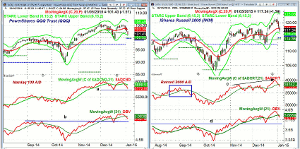
|pagebreak|The PowerShares QQQ Trust (QQQ) has been in a range since the late November high at $105.86. The rally last week did not result in new highs as many of the biotech components have been under pressure.
- The daily starc- band is at $100.85 with the monthly projected pivot support is at $100.02.
- The quarterly pivot is just a bit lower at $99.67 with the December low at $99.55.
- There is even stronger support in the $96.80-$98.40 area.
- The Nasdaq 100 A/D line is also in a trading range as it dropped below its WMA last week. It did confirm the late November high.
- The A/D line has next good support at line a, with more important at the September highs.
- The daily OBV was stronger than prices last week, though it is now slightly below its WMA.
- The OBV has stronger support now at line b.
- The 20-day EMA is at $103.39 and a close back above $105 would be bullish.
The iShares Russell 2000 (IWM) surged from a December low of $112.61 to a high last week at $121.41. This was a rise of 7.8%.
- The daily starc+ band is now at $123.03 with the monthly projected pivot resistance at $126.68.
- On Monday, IWM closed just below the 20-day EMA at $118.03 with the daily starc- band at $116.26.
- The quarterly pivot is at $114.73 with the monthly projected pivot support at $114.35.
- The Russell 2000 A/D surged to significant new highs last week, line c, as it was as strong as prices.
- The A/D line is back below its WMA but does not show a typical top formation like what was formed in August-September (see box).
- The daily OBV was also strong last week but is now back below its rising WMA.
- The OBV has major support now at line d.
- There is resistance now in the $118.90-$120 area.
What it Means: Though the futures are trying to stabilize in early trading, there are no signs yet that the correction is over. As I discussed in Monday’s Get an Edge from Yearly Charts, there are no signs of a top from the yearly charts of the S&P 500 or Dow Industrials. These charts gave one plenty of advance warning about crude oil prices and gold’s top in 2013.
I think this correction will be short lived, but it is possible we will see a week or more of choppy to lower trading before it is over. We are likely to see some sector rotation in this correction, so I will be looking for new market leaders.
I will also be looking to buy the Spyder Trust (SPY) and PowerShares QQQ Trust (QQQ) near their quarterly pivots and the December lows where the risk can be well controlled.
How to Profit: No new recommendation.
Portfolio Update: As per the December 4 Tweet, traders are 50% long the iShares Russell 2000 (IWM) at $116.88 and 50% long at $114.96 with a stop now at $113.88.


