Investors worry the Nasdaq Composite could move above the March 2000 high, but it's a different index today, so MoneyShow's Tom Aspray examines the quarterly chart to see if it could make a new high and reviews some of its widely followed stocks.
Stocks were a bit lower Wednesday but have erased these losses in early trading on Thursday. The markets were troubled yesterday by reports of new Russian military shipments into Ukraine. The market has apparently already discounted this, but as I have mentioned previously, it is the weekly close that will be the most important.
The market internals were slightly positive Wednesday as many are waiting for the Retail Sales report on Friday. It has been a wild week for the retail stocks as, while Macy's (M) reported a drop in sales, its stock closed up over 5%. Weaker sales were also reported by J.C. Penney Co. (JCP) as their stock was up sharply before earnings but gave up all of those gains on Wednesday.
The level of bullish sentiment continues to rise as the latest Sentiment Survey from AAII reports that 57.93% are now bullish, up from 52.69% the previous weak. The bearish percentage also rose up to 19.31% from 15.05% the prior week.
A recent addition to the investor's wall of worry has been the possibility that the Nasdaq Composite could finally move above the March 2000 high of 5132. This is despite the fact that it is still 9.7% below those highs and that the Nasdaq Composite is now a totally different index.
The P/E now is 26.5 and at the end of 1999 it was about 200 as reported in a January 2000 article Nasdaq's `Economic Wonderland'. It is also important to note that there were about twice as many stocks in the Nasdaq Composite in 2000 than there are now.
A look at the quarterly chart of the Nasdaq Composite allows me to assess the prospects that it could eventually make a new high and also an opportunity to review some of its most widely followed stocks.
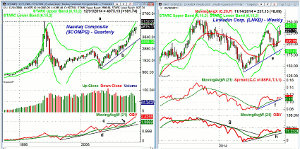
Chart Analysis: It requires a quarterly chart of the Nasdaq Composite in order for one to see the March 2000 high at 5132, line a.
- In the last quarter of 2008 and the 1st quarter of 2009, the index dropped below its starc- band as it had a low of 1265.
- The uptrend from the lows, line b, has been impressive as it has gained 269%.
- The quarterly starc+ band is at 5116, which is just below the 2000 high.
- There is short-term support now at 4550-4600 with the quarterly projected pivot support at 4475.
- The first good quarterly chart support is now in the 3900-4100 area.
- The quarterly OBV broke through two-year resistance, line c, in 2013 and has continued to make higher highs.
- The weekly OBV (not shown) has not yet made new highs but the daily OBV has.
LinkedIn Corp. (LNKD) has a market cap of $28.7 billion and a forward P/E of 91.3.
- The weekly starc+ band is now at $241.17 with monthly pivot resistance at $244.92.
- The decline from the early September high retraced just 50% of the rally from the early May lows.
- Corrections within an uptrend often take prices back to the 38.2%-50% Fibonacci support zones.
- The correction dropped prices just slightly below the 20-week EMA as it held above the uptrend, line e.
- The weekly relative performance bottomed at the end of May and is still in a short-term uptrend, line f.
- The weekly OBV broke through its downtrend, line g, at the start of August and is still holding above its WMA.
- The 20-day WMA and monthly pivot are both in the $218 area.
- The daily starc- band is at $208.32 with the 20-week EMA at $206.96.
NEXT PAGE: Two More Widely Followed Stocks to Watch
|pagebreak|Netflix, Inc. (NFLX) has a market cap of $23.1 billion and a forward P/E of 64.3, which is still well below the Nasdaq's P/E in 2000.
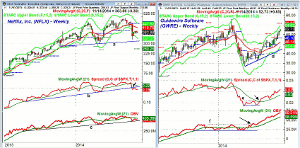
- It has dropped sharply from the September high of $489.29 as it has dropped 21.5%.
- The weekly starc- band is at $337.07 with more important weekly chart support at $317.
- The quarterly projected pivot support is at $260.26.
- NFLX dropped well below its starc- band in October and the recent rebound looks like a bounce in a downtrend.
- This is consistent with the action of the relative performance, which dropped below support, line b, in October.
- The OBV dropped below its WMA last month and is now testing more important support at line c.
- The daily OBV (not shown) is also negative.
- NFLX is trying to close above its 20-day EMA at $391.68 with the monthly pivot at $397.25.
Guidewire Software, Inc. (GWRE) is a $3.6 billion provider of software for property and casualty insurers. It has a forward P/E of 82.7 and is 9% below its 52-week high from March of $58.
- The rally over the past three weeks has taken GWRE close to its weekly starc- band at $54.62.
- The monthly projected pivot resistance is at $55.85.
- The relative performance completed its bottom formation in August as it moved above resistance, line e, at the start of August (see arrow).
- The RS line is in a solid uptrend and above its WMA but is still below the year's high.
- The weekly on-balance volume (OBV) has been leading prices higher.
- It staged an upside breakout in June as it overcame resistance at line f and it continues to act stronger than prices.
- The sharply rising 20-day EMA is now at $49.85 with the monthly pivot at $48.10.
What it Means: The quarterly analysis of the Nasdaq Composite suggests it could move above the 2000 highs but it is not likely until next year. I think this is not something that investors should be concerned about.
Clearly, the current high levels of bullish sentiment along with many of the averages at or near the weekly starc+ bands and quarterly resistance make the market vulnerable as I discussed in last week's Three Reasons Not to Jump into Stocks Now.


