Barron’s recently asked eight experts for their 14 top stock recommendations and even though some aren’t traded in the US, MoneyShow’s Tom Aspray takes a long look at those that are and shares the four he feels have the best charts.
It was another day of decent gains for the stock market as the Dow Transports led the way again as it was up 1.33% versus just a 0.23% rise in the Dow Industrials. This keeps the Dow Theory positive.
The iShares Dow Jones Transportation ETF (IYT) is now just 0.6% below its quarterly projected pivot resistance at $163.47. In contrast, the Spyder Trust (SPY) is still over 2% below its quarterly resistance at $208.43.
The market internals were positive but the McClellan oscillator is flat at +161 and still diverging from prices. As I noted in the Week Ahead column, it is this week’s close that will be important. A strong weekly close could reverse the warning signs from the weekly OBV analysis. On the other hand, a sharply lower close would raise further red flags from the weekly volume analysis.
In Barron’s recent Art of Successful Investing Conference, they assembled eight of their frequently quoted experts to get their market opinions and current stock recommendations. The consensus was that US stocks look the best and that bond yields can continue to decline as foreign investors search for safety.
They also provided the rationale for their fourteen stock recommendations, which can be reviewed in their article The Smart Money Speaks: 14 Picks. Several of their choices are not traded in the US, but I took a long look at those that can be traded and selected the four that I felt had the best charts.
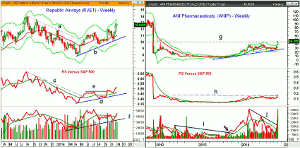
Chart Analysis: The airlines have had a great run this year as the DJ US Airlines Index (DJUSAR) is up 68%. Stelliam Investment Management’s Ross Margolies likes both Delta Airlines (DAL) and Republic Airways (RJET), which, in my view, has the best chart.
- RJET made its low in April as it triggered a weekly HCD buy signal (see arrow).
- It is up over 22% YTD, but last week formed a doji as it was just 3% below the weekly starc+ band, which is at $13.66.
- The monthly projected pivot resistance is at $14.66.
- The weekly chart shows a solid uptrend (line b) with support at $11.99, which was the September high.
- The rising 20-week EMA is now at $11.21.
- The relative performance broke its downtrend, line c, just after the April lows.
- The RS analysis has completed its bottom by moving above the resistance at line e.
- The weekly on-balance volume (OBV) show a solid uptrend from the April lows, line f, and has moved back above its WMA.
- The daily OBV (not shown) turned positive on October 22 and still looks strong.
- The 20-day EMA and short-term support is at $12.08 with the daily starc- band at $11.72.
ANI Pharmaceuticals (ANIP) is an under-the-radar biotechnology pick from Oscar Schafer and has a market cap of $464 million.
- The long-term weekly chart shows last week’s close above resistance from 2012, line g, in the $44.28 area.
- The close was well above the weekly starc+ band.
- There is further resistance in the $62 area and in 2011 ANIP had a high of $144.70.
- The relative performance has also completed a major base formation as it has overcome resistance at line h.
- The weekly OBV completed a major base in September 2013 as it broke though a major downtrend, line i, even though prices were still in a tight range.
- Volume surged in early 2014 and again over the past month as the OBV moved through its downtrend.
- The daily OBV is also strong as it jumped to 1.5 million shares on November 3, which was seven times the average.
- There is first support well above current levels at $40-$42 with the 20-day EMA at $36.52.
NEXT PAGE: Two More Stocks with the Best Charts to Watch
|pagebreak|Synnex Corp. (SNX) was recommended by Scott Black, the founder of Delphi Management, and is a technology distributor, but Mr. Black was especially interested in their new division that provides “custom assembly for customers such as Facebook.”
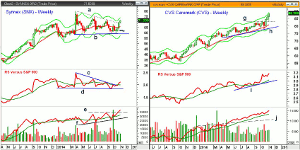
- The weekly chart shows that SNX has completed a flag formation, lines a and b, as resistance was overcome last week.
- The quarterly projected pivot resistance is just a bit higher at $72.74 with the weekly starc+ band at $74.28.
- The flag formation has upside targets in the $80-$84 area.
- The RS line has completed a similar continuation pattern as resistance at line c, was overcome on October 24 as an HCD was also triggered (see arrow).
- The weekly OBV has broken out to new highs (line e) as it is leading prices higher.
- The daily OBV (not shown) has also confirmed the price action.
- The breakout level is at $68.23 with the 20-day EMA at $67.25.
CVS Caremark (CVS) was recommended by Bill Priest of Epoch Investment Partners even though it has had a good year, so far, up over 26%. He thinks that it still has room to grow as he said “CVS is one of the top two retail pharmacies in the US. It is taking market share from competitors literally every month.”
- CVS closed last week at the weekly starc+ band.
- It has already moved above the quarterly projected pivot resistance at $86.53.
- The weekly chart shows that CVS broke though resistance at $82.74 (line g) three weeks ago.
- The RS line has formed higher highs and higher lows since November 2013 and made a new high with prices last week.
- The weekly on-balance volume (OBV) dropped back to test its WMA at the February lows and then moved through resistance in May (line j).
- The daily OBV has also confirmed the new highs.
- The 20-day EMA is now at $85.11 with the monthly pivot support at $83.37.
What it Means: All four stocks look ready to move even higher over the intermediate-term but most are also quite a ways above good support and well more than 5% above a likely stop level.
For example, ANI Pharmaceuticals (ANIP) is the only one that has just recently completed a major base formation and looks the most compelling long-term. It is 32% above its 20-day EMA and a stop would need to go under $30 right now, which is a risk of 37% from Monday’s close. Therefore, it needs to develop a new range so that a tighter stop can be used.
The completion of the flag formation in Republic Airways (RJET) would mean that a retest of the breakout level should be a reasonable entry strategy.
How to Profit: For Republic Airways (RJET) go 50% long at $11.74 and 50% at $11.38 with a stop at $10.93 (risk of approx. 5.4%), cancel if $14 is hit first.


